Understand space usage statistics – HP Neoview Release 2.4 Software User Manual
Page 127

are reported on, and then selectively view each in the graph. Space Management employs a color
scheme to display each metric and its performance.
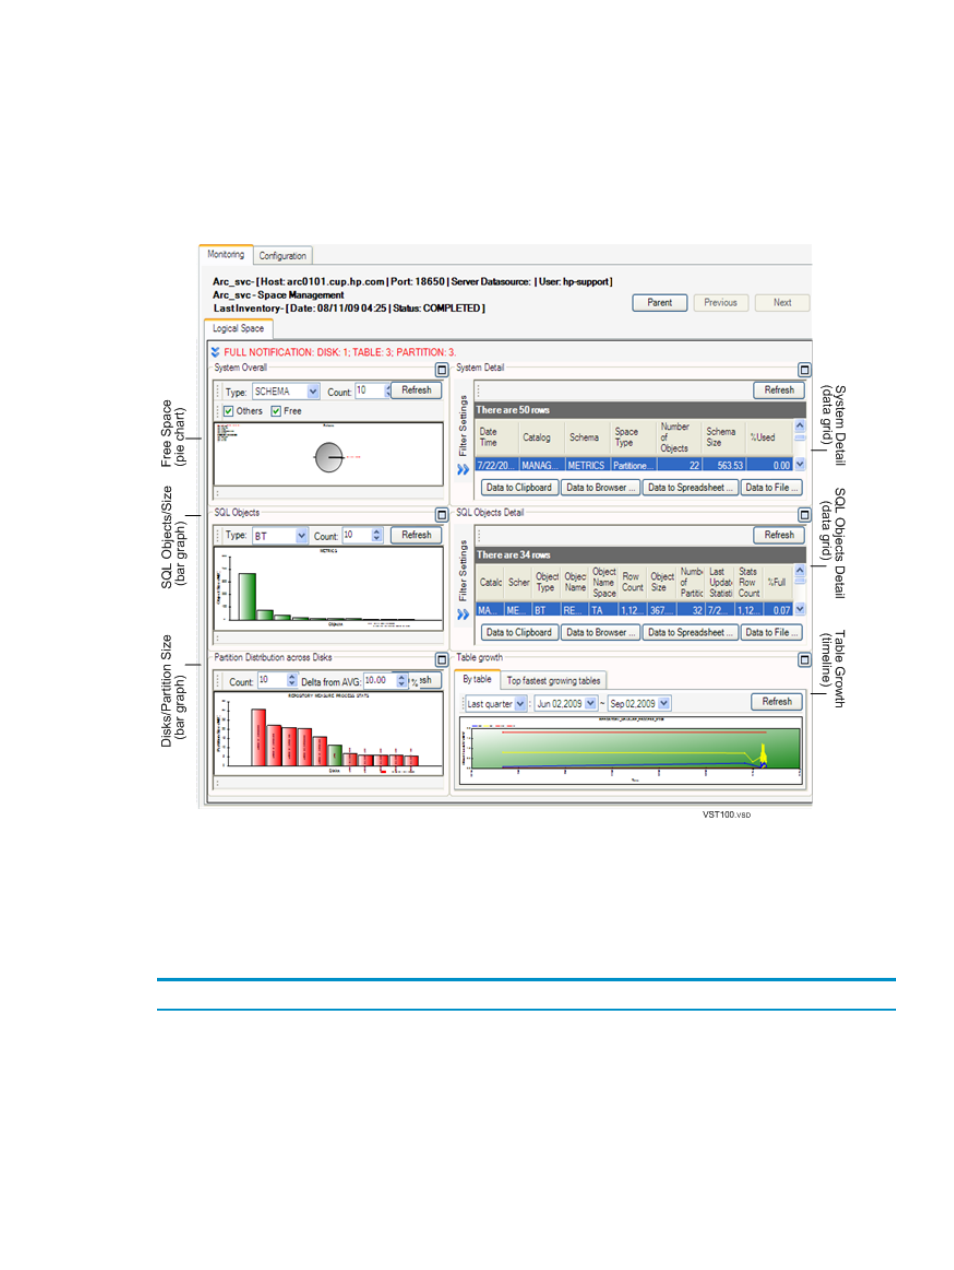
Each panel in the Monitoring tab can be enlarged by clicking the box icon on the right of the
heading. When the display is focused on one panel, you can no longer view information from
the other panels. To return to the full system view, click the box icon again.
At the top of the Monitoring tab, connection information and last inventory status are displayed.
This figure shows the different parts of the Space Management interface:
Related Topics
“About the Monitoring Tab” (page 128)
Understand Space Usage Statistics
Space Management shows six panels of detailed SQL space usage statistics:
Description
Panel
Pie chart view of the amount of space used on the Neoview by Category, Schema, Table, or
by User.
System Overall
Detailed grid view of the total SQL space size per schema.
System Detail
Bar graph view of the SQL objects within the schema (including base tables, materialized
views, and indexes).
SQL Objects
Detailed grid view of the SQL objects within the schema.
SQL Objects Detail
Understand Space Usage Statistics
127
