Alcatel-Lucent 8950 AAA User Manual
Page 287
Server Statistics Panel
Server Statistics
............................................................................................................................................................................................................................................................
365-360-001R6.0
Issue 1, December 2008
17-9
............................................................................................................................................................................................................................................................
The performance monitor can be used to display current information regarding the
average rate of processing a packet within the defined interval or based on total packets
processed. Select one or both checkboxes to display the graphical data.
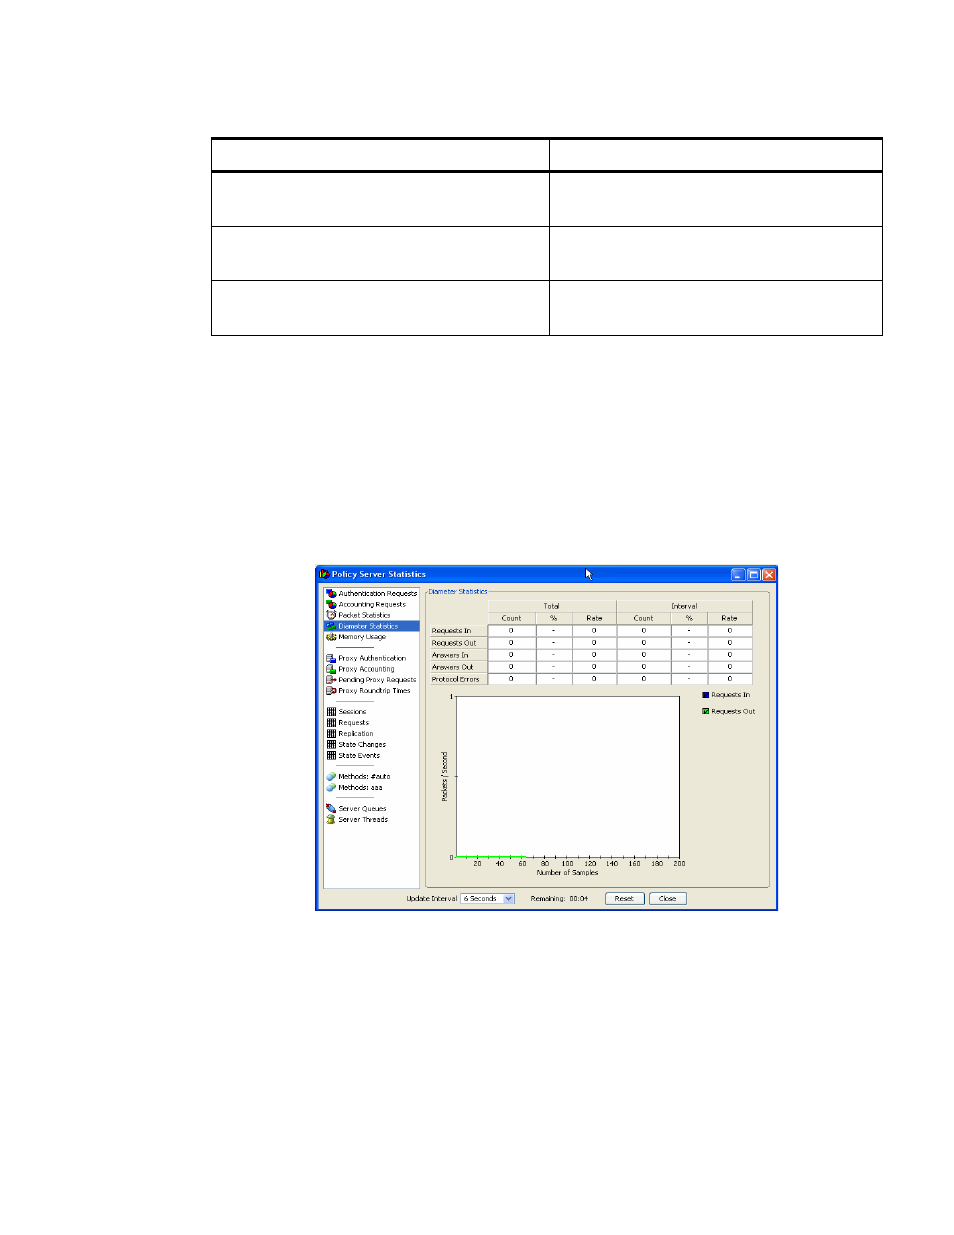
Diameter Statistics
shows the screen for monitoring diameter statistics. It displays a columnar
information and a performance monitor (graph).
Figure 17-6 Server Statistics–Diameter Statistics
There are two columns Total and Interval which keeps the count of total number of
requests flowing from and to the diameter server.
Average Milliseconds / Packet
Average (Mean) rate of amount of taken to
process a packet.
Minimum Milliseconds
Least amount of time spent processing a
single packet.
Maximum Milliseconds
Greatest amount of time spent processing a
single packet.
Table 17-6 Radius Items–Tabulated Items
RADIUS Item
Description