12 current output, 13 response time, 14 internal resistance of cell – Yokogawa Integral Oxygen Analyzer ZR202 User Manual
Page 132
IM 11M12A01-05E
10-5
10. Other Functions
10.1.12 Current Output
The analog output current is displayed.
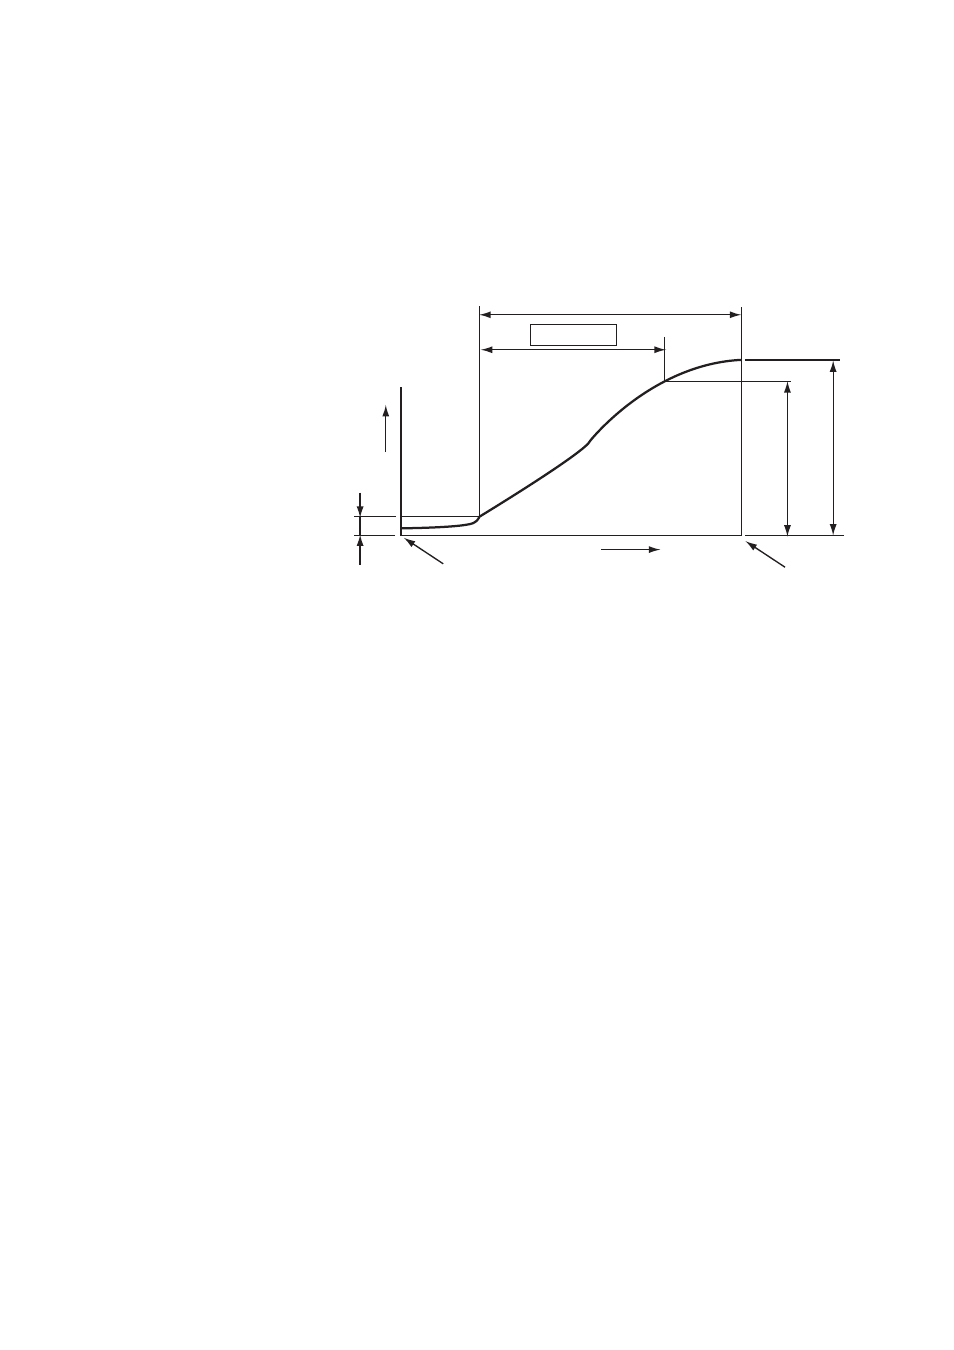
10.1.13 Response Time
The cell’s response time is obtained in the procedure shown in Figure 10.1. If only
either a zero-point or span calibration has been carried out, the response time will not be
measured just as it will not be measured in manual calibration.
mA
90%
100%
The response time is obtained after the corrected calibration curve has been found. The response time
is calculated, starting at the point corresponding to 10% of the analog output up to the point at 90% of
the analog output span. That is, this response time is a 10 to 90% response.
10% of analog
output span
Five minutes maximum
Response time
Start calibration
Time
Calibration
complete
F10.1E.EPS
Figure 10.1 Functional Drawing of Response Time
10.1.14 Internal Resistance of Cell
A new cell (sensor) indicates its internal resistance of 200 V maximum. As the cell
degrades, so will the cell’s internal resistance increase. The degradation of the cell
cannot be found only by changes in cell’s internal resistance, however. Those changes
in the cell’s internal resistance will be a hint to knowing the sensor is degrading. The
updated values obtained during the calibration are displayed.