6 editing a kinetic record, Editing a kinetic record – Xylem photoLab 6100 VIS User Manual
Page 97
photoLab
®
6100 VIS
Operation
97
ba75847e01
08/2009
4.9.6
Editing a kinetic record
The following functions are available for kinetic records:
z Moving along the curve with the cursor
z Displaying a list with the slopes of the curve for each interval
z Scaling the Y-axis of the diagram
z Combined display of two kinetic records in one graphic
z Display of the difference of two kinetic records
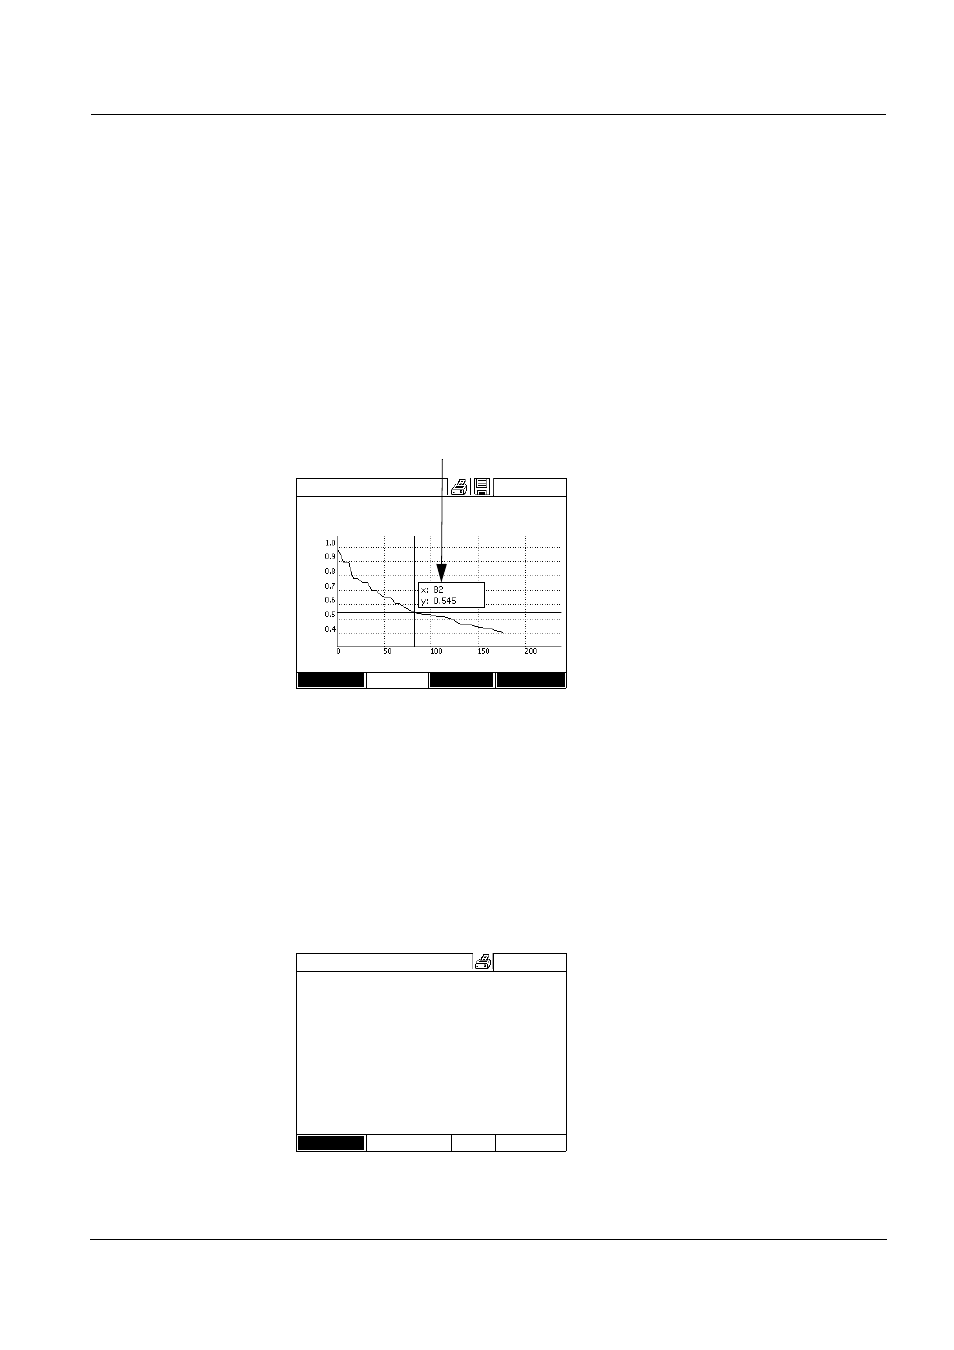
Cursor
Slope of the curve &
catalytic activity
The function, Slope indicates the slope of the kinetic curve in the individual
intercepts (intervals) of the curve.
An intercept corresponds to the Interval entered in the profile.
The cursor consists of a horizontal
and vertical line that cross each
other on a point of the curve. A box
names the x and y values of the
point of the curve.
Move the cursor along the x axis
(time axis) with <
W><X>. You can
scan and evaluate the curve point
after point.
Kinetics
04/16/07 9:52
4002
Number of measurements: 4
Duration: 00:00:24
Interval:00:00:06
Time [s]
Setup
Edit
Open
Ab
so
rb
anc
e
Cursor information
1
Indicate the slope of the kinetic
curve in the individual intercepts
(intervals) of the curve with [Edit] /
Slope.
If the calculation of the catalytic
activity was selected when the
profile was created it is displayed
here together with the slope.
Kinetics
04/16/07 9:52
0.63
cat
Interval
Slope (Δ/min)
Time
1
0.000
5 s
2
0.000
10 s
3
0.000
15 s
4
0.000
20 s
5
0.000
25 s
6
0.000
30 s
Back