Xylem photoLab 6100 VIS User Manual
Page 66
Operation
photoLab
®
6100 VIS
66
ba75847e01
08/2009
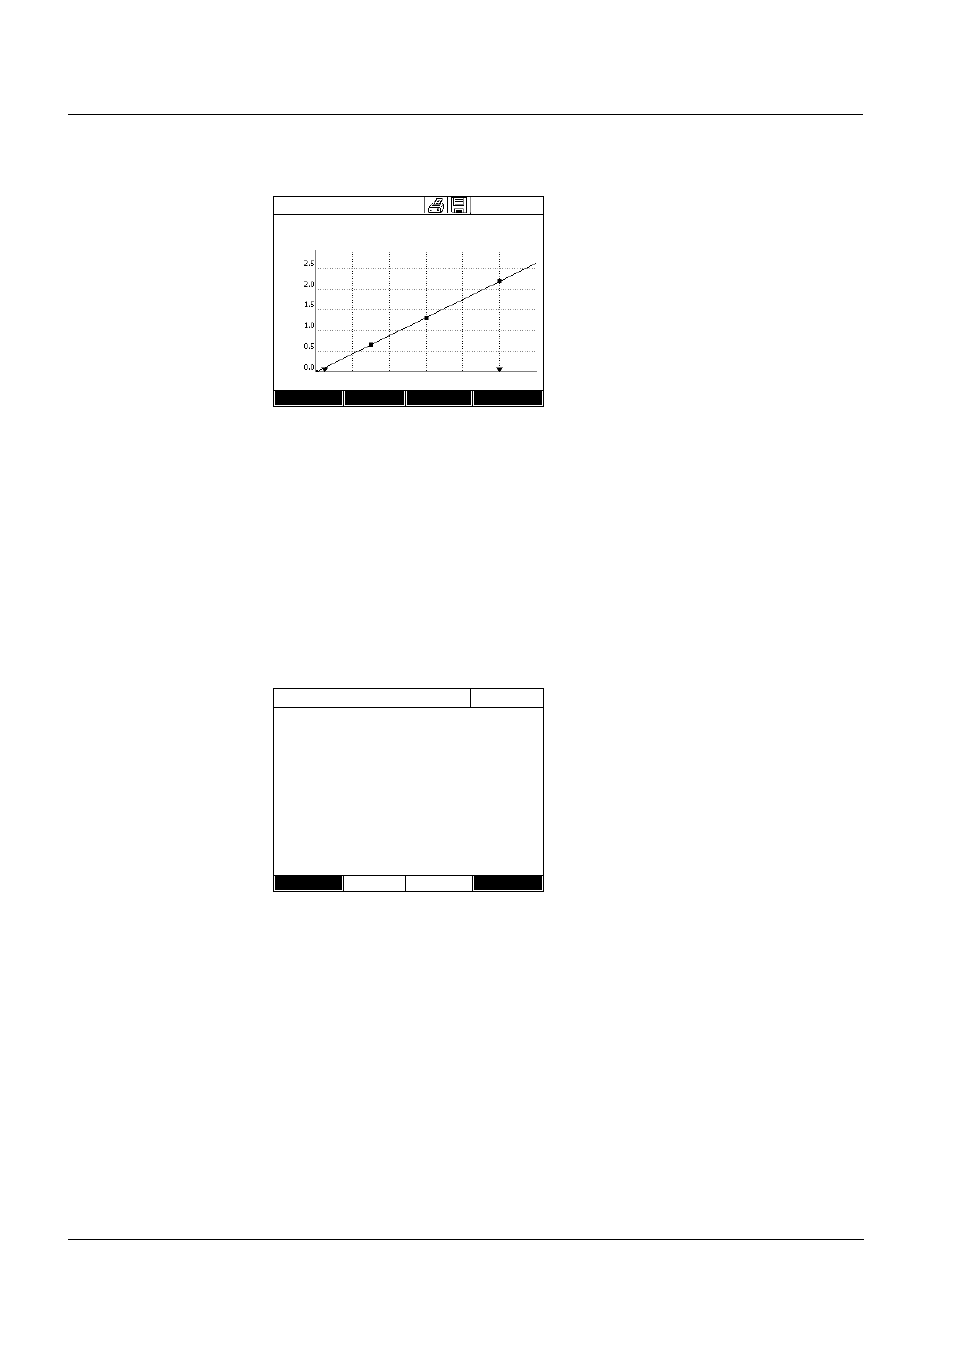
Variant 2:
Enter value pairs
Unlike variant 1, the fields of the Absorbance column are filled out manually
here. Accordingly, the steps 6 to 10 are not applicable here. Apart from that,
the proceeding is identical to variant 1.
The related formula f(x) and
correlation coefficient R
2
are
displayed above the diagram.
12 If required, select a different line
type for the line adjustment with
[Curve type].
- Polygon line
- Straight line
- Parabola
13 If required, enter different
measured value limits with [Meas.
range].
- Lower limit
- Upper limit
14 Using [Next], complete the editing
of the calibration line and proceed
to the next page.
The timers and AQA2 data linked
to the method are displayed.
15 If necessary, enter intervals for up
to 4 timers.
16 If necessary, enter the AQA2
target value and AQA2 tolerance.
17 Complete the programming of the
method with [Complete].
The method is programmed and
selected for measuring.
Edit method
04/16/07 9:52
f(x)=0.73x
R
2
= 1.000
Meas. range: 0.050 - 1.000 mg/l
Concentration [mg/l NO2-N]
Back
Curve type
Meas. range
Next
Ab
so
rb
anc
e
Edit method
04/16/07 9:52
Timer 0
00:00:00
Timer 1
00:00:00
Timer 2
00:00:00
Timer 3
00:00:00
AQA2 target value
1.00 mg/l
AQA2 tolerance
0.10 mg/l
Back
Complete