Hitachi MK-96RD617-08 User Manual
Page 93
Performance
Monitor
Operations
5-11
Hitachi Universal Storage Platform V/VM Hitachi Performance Manager User’s Guide
Notes:
The list displays up to a maximum of 4,096 resources at a time. If the
number of resources exceeds 4,096, use Previous and Next to display
the remaining resources.
If you change the date and time in the From and To boxes and then click
Apply, Performance Monitor recalculates usage rates and updates
information in the list. To change the date and time in From and To
boxes, use the arrow buttons and the sliders (for details, see
Performance Management Window, Physical Tab).
If an exclamation mark (!) is displayed before a usage rate, the reported
volume usage rate is likely to be inaccurate, because the configuration
has changed (e.g., volumes have been moved by Volume Migration or
ShadowImage, or formatted by Virtual LVI or Open Volume
Management). For information on using Volume Migration, contact the
Hitachi Data Systems Support Center (see Calling the Hitachi Data
Systems Support Center.
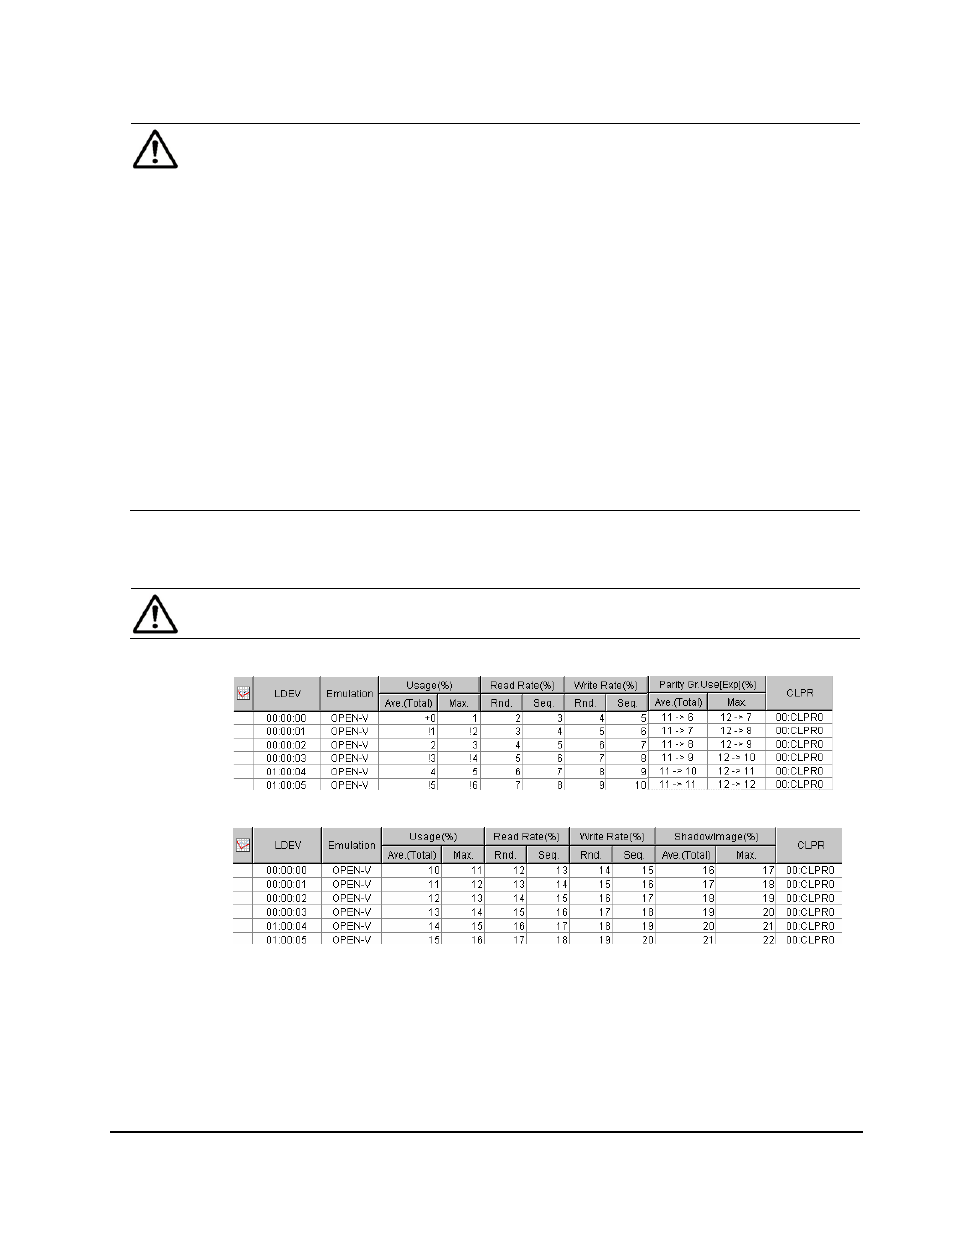
If a plus mark (+) is displayed before a usage rate 0, such as "
+0
", the
usage rate is not completely 0 but less than 1.
6. To display a graph illustrating changes in usage rate for volumes, select the
desired volumes in the list and then click Draw.
Note: The range of monitoring and the gathering interval affects the time
period represented by a graduation on the horizontal axis.
When selecting longrange for storing period of statistics:
When selecting shortrange for storing period of statistics:
Figure 5-4
Examples of Volume Usage Rates Displayed