Hitachi MK-96RD617-08 User Manual
Page 56
4-14
Using the Performance Manager GUI
Hitachi Universal Storage Platform V/VM Hitachi Performance Manager User’s Guide
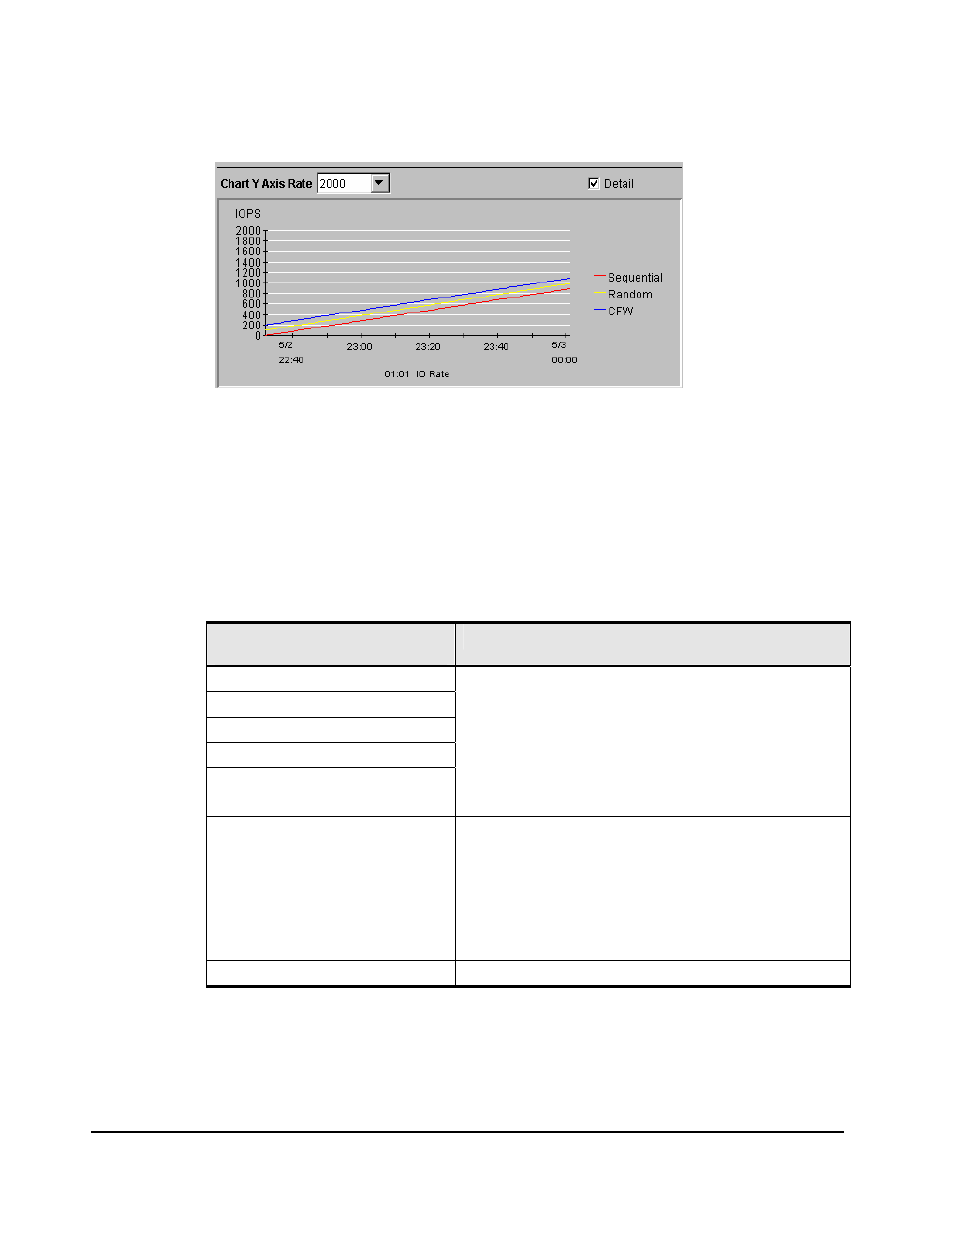
When you draw a graph, use the Detail check box to illustrate the desired
information and the Chart Y Axis Rate list to arrange the graph as you
like.
Figure 4-7
Chart Y Axis Rate List and Detail Check Box (LDEV Tab)
Use the Chart Y Axis Rate list to select the highest value of the Y-axis
(the vertical axis) of the graph.
If you select Detail and then click Draw, the graph displays detailed
statistics as explained in Table 4-2. The information in the graph depends
on the item selected in the list on the right.
Table 4-2
Detailed Information that can be Displayed in the Graph (LDEV
Tab)
Select Detail and this Item in the
List
The Graph Contains
IO Rate
Read
Write
Read Hit
Write Hit
- statistics in sequential access mode
- statistics in random access mode
- statistics in CFW (cache fast write) mode
Note: If the read hit ratio or the write hit ratio is high,
random access mode is used for transferring data instead
of sequential access mode. For example, random access
mode is likely to be used for transferring data to disk areas
to which the Cache Residency Manager function is applied.
Back Trans.
- the number of data transfers from the cache memory to
hard disk drives ("Cache to Drive")
- the number of data transfers from hard disk drives to the
cache memory in sequential access mode ("Drive to Cache
Sequential")
- the number of data transfers from hard disk drives to the
cache memory in random access mode ("Drive to Cache
Random")
Trans.
The graph does not display detailed information.