Hitachi MK-96RD617-08 User Manual
Page 136
6-4
Server Priority Manager Operation
Hitachi Universal Storage Platform V/VM Hitachi Performance Manager User’s Guide
Prio. indicates a prioritized port.
Non-Prio. indicates a non-prioritized port.
Figure 6-2
Priority Specified in the Server Priority Manager Window
2. Monitor traffic at ports. You must obtain statistics about traffic at each port
on the storage system.
There are two types of traffic statistics: the I/O rate and the transfer rate.
The I/O rate is the number of I/Os per second. The transfer rate is the size
of data transferred between a host and the storage system. When you view
traffic statistics in the window, you select either the I/O rate or the transfer
rate. The Port-LUN tab of the Performance Management window lets
you view a line graph illustrating changes in traffic.
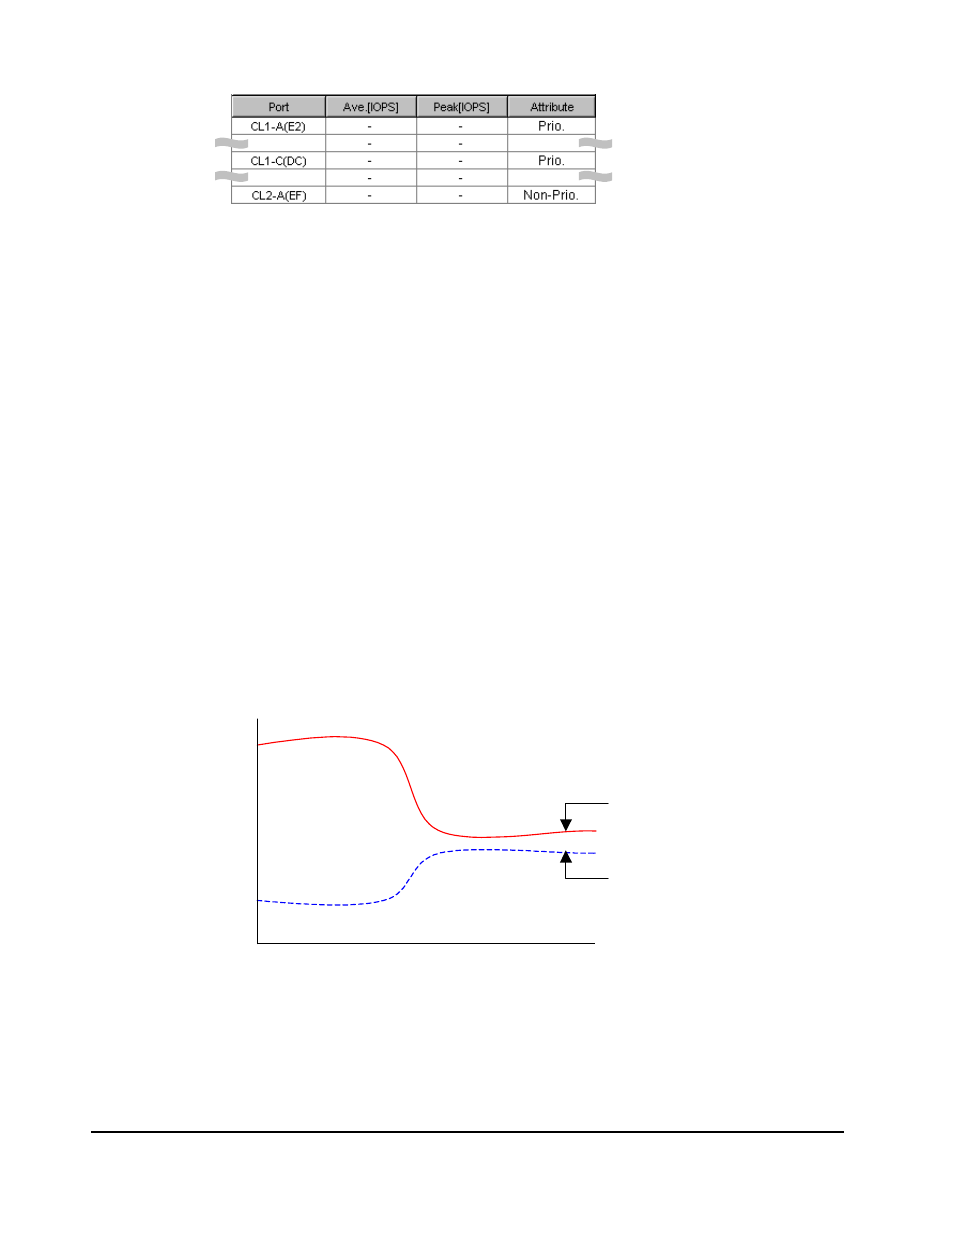
Figure 6-3 is a graph illustrating changes in the I/O rate for the three ports
(1A, 1C, and 2A). According to the graph, the I/O rate for 1A and 1C was
approximately 400 IO/s at first. The I/O rate for 2A was approximately 100
IO/s at first. However, as the I/O rate for 2A gradually increased from 100
IO/s to 200 IO/s, the I/O rate for 1A and 1C decreased from 400 IO/s to
200 IO/s. This fact indicates that the high-priority production servers have
suffered lowered performance. If you were the network administrator, you
probably would like to maintain the I/O rate for prioritized ports (1A and
1C) at 400 IO/s. To maintain the I/O rate at 400 IO/s, you must set an
upper limit to the I/O rate for the port 2A.
For detailed information about monitoring traffic, see Setting Priority for
Ports on the Storage System and Analyzing Traffic Statistics.
400
I/O rate (IO/s)
200
time
100
300
prioritized ports
(1A and1C)
non-prioritized port
(2A)
Figure 6-3
Traffic at Ports