Viewing port workload statistics – Hitachi MK-96RD617-08 User Manual
Page 61
Using the Performance Manager GUI
4-19
Hitachi Universal Storage Platform V/VM Hitachi Performance Manager User’s Guide
The graph displays detailed statistics about workloads on the port
selected in the list. For details on the graph, see Viewing Port Workload
–
When you select LUN ( )in the tree and select a LUN (an address of a
volume) in the list.
The graph displays detailed statistics about workloads on the LU paths
selected in the list. The information in the graph depends on the item
selected in the list on the right of the Detail check box. For details on
the graph see Viewing Workload Statistics on LU Paths.
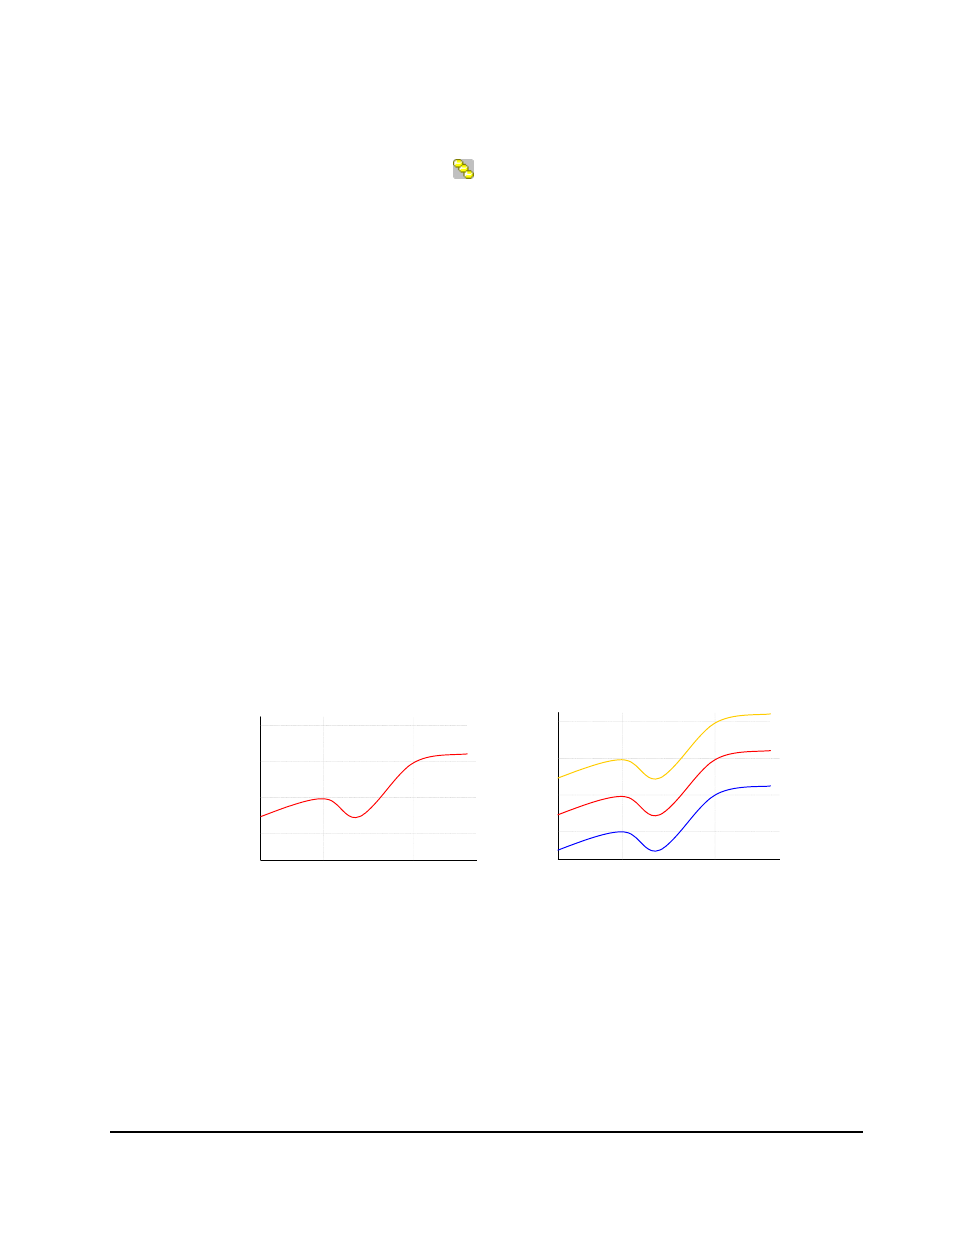
Viewing Port Workload Statistics
Figure 4-10 shows an example of a graph displaying information about
workload of a port. In this example, port CL1-A was selected in the list
before clicking Draw. In this example, 1 minute is specified as the
gathering interval. The graph contents changes depending on the selection
of the Detail check box. The figure shows the following:
–
The workload on the port CL1-A is 200 IO/s at 8:00, and 300 IO/s at
10:00 (refer to the graph on the left).
–
For the period of 7:59 to 8:00, the maximum workload on CL1-A is 300
IO/s. The average workload on CL1-A is 200 IO/s. The minimum
workload on CL1-A is 100 IO/s (refer to the graph on the right).
–
For the period of 9:59 to 10:00, the maximum workload on CL1-A is
400 IO/s. The average workload on CL1-A is 300 IO/s. The minimum
workload on CL1-A is 200 IO/s (refer to the graph on the right).
–
When Detail is deselected, only one line appears in the graph. This line
is equivalent to the line Ave. (1 min), which appears when Detail is
selected.
10:00
08:00
400
I/O rate(IOPS)
200
Time
100
300
CL1-A
If the Detail check box is deselected
10:00
08:00
400
I/O rate(IOPS)
200
Time
100
300
Ave. (1 min.)
Min. (1 min.)
Max. (1 min.)
If the Detail check box is selected
Figure 4-10
Graphs Illustrating Changes in Workloads on a Port