Hitachi MK-96RD617-08 User Manual
Page 128

5-46 Performance
Monitor
Operations
Hitachi Universal Storage Platform V/VM Hitachi Performance Manager User’s Guide
5. In the tree, do one of the following:
–
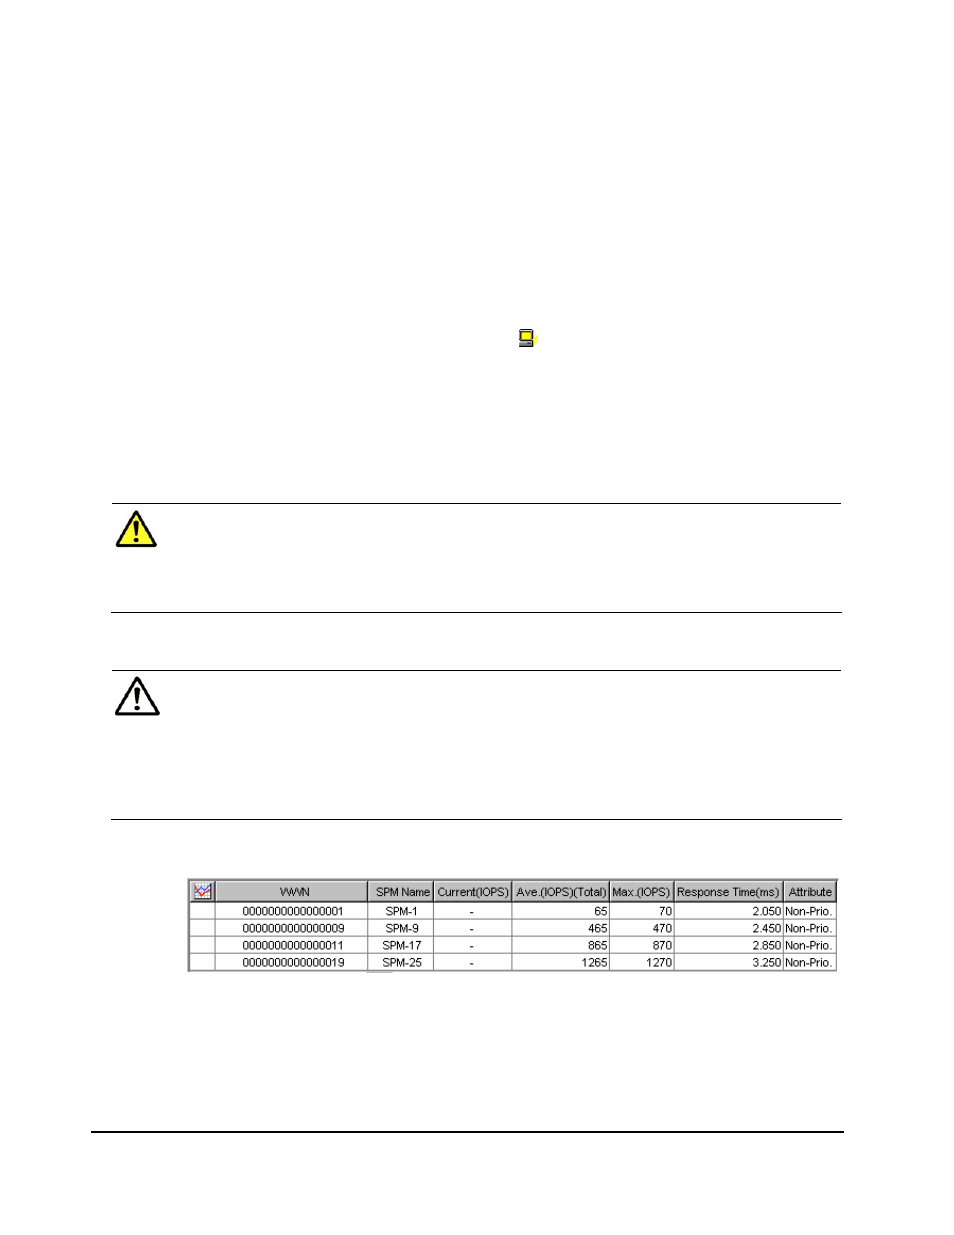
To view the I/O rate for host bus adapters in an SPM group, select the
SPM group.
The list on the right displays the I/O rate.
–
To view the I/O rate for host bus adapters that do not belong to any
SPM group, select Not Grouped.
The list on the right displays the I/O rate.
Tips:
–
If you select the Subsystem folder in the tree, the list displays the I/O
rate at each SPM group.
–
If you select a host bus adapter ( ) in the tree, the list displays the I/O
rate at each port connected to the selected host bus adapter.
6. If you want to display a graph to find out how the I/O rate has been
changed, take the following steps:
a. In the list, select one or more SPM groups, WWNs, or ports.
b. Click Draw.
Caution: If the graph does not display changes in the I/O rate (for
example, if the line in the graph runs vertically), try changing the value in
the Chart Y Axis Rate list. For example, if the largest value in the list is
200 and the value in Chart Y Axis Rate is 100, you should select a value
larger than 200 from Chart Y Axis Rate.
Note: If the WWN of a host bus adapter (HBA) is displayed in red in the
tree, the host bus adapter is connected to two or more ports, but the traffic
between the HBA and some of the ports are not monitored by Performance
Monitor. When many-to-many connections are established between HBAs
and ports, you should make sure that all the traffic between HBAs and
ports is monitored. For details on the measures when a WWN is displayed
in red, see Monitoring All Traffic between HBAs and Ports.
I/O rate at host bus adapters
(Displayed when an SPM group or Not Grouped is selected):
