Hitachi MK-96RD617-08 User Manual
Page 35
About Performance Manager Options
2-19
Hitachi Universal Storage Platform V/VM Hitachi Performance Manager User’s Guide
•
I/O rates and transfer rates. Server Priority Manager runs based on I/O
rates and transfer rates measured by Performance Monitor. Performance
Monitor measures I/O rates and transfer rates every second, and calculates
the average I/O rate and the average transfer rate for every gathering
interval (specified between 1 and 15 minutes) regularly.
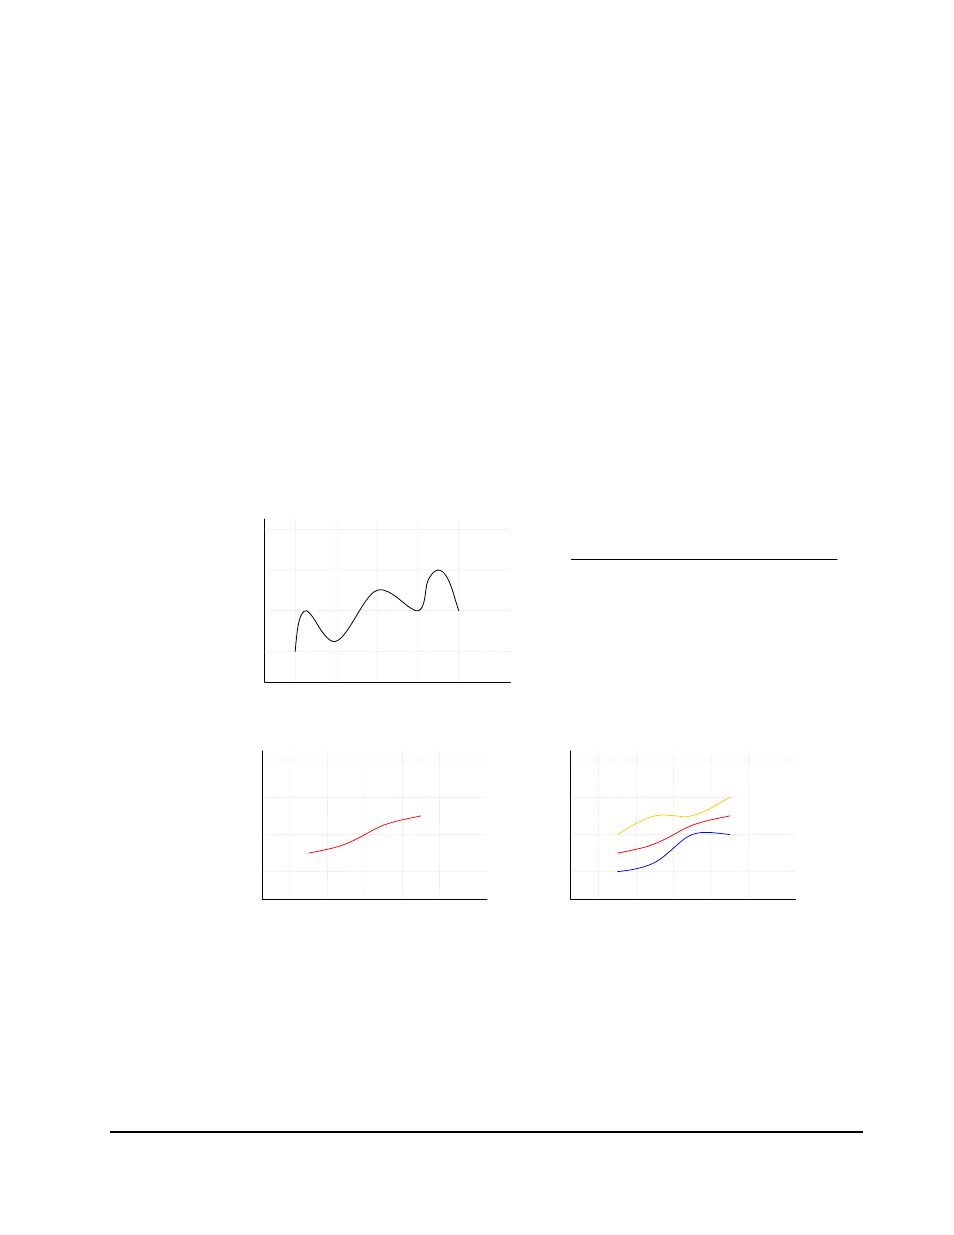
Suppose that 1 minute is specified as the gathering interval and the I/O
rate at the port 1-A changes as illustrated in Graph 1 in Figure 2-3. When
you use Performance Monitor to display the I/O rate graph for 1A, the line
in the graph indicates changes in the average I/O rate calculated every
minute (refer to Graph 2). If you select the Detail check box in the
Performance Management windows, the graph displays changes in the
maximum, average, and minimum I/O rates in one minute.
Server Priority Manager applies upper limits and thresholds to the average
I/O rate or the average transfer rate calculated every gathering interval.
For example, in Figure 2-3 in which the gathering interval is 1 minute, if
you set an upper limit of 150 IO/s to the port 1A, the highest data point in
the line CL1-A in Graph 2 and the line Ave.(1 min) in Graph 3 is
somewhere around 150 IO/s. It is possible that the lines Max (1 min.) and
Min (1 min.) in Graph 3 might exceed the upper limit.
08:03
08:00
400
I/O rate(IOPS)
200
time
100
300
CL1-A
Graph 1: Actual I/O rate (measured every second)
08:01 08:02
08:04
Period Minimum Average Maximum
08:00 - 08:01 100 160 200
08:01 - 08:02 130 180 250
08:02 - 08:03 200 225 250
08:03 - 08:04 200 250 300
08:03
08:00
400
I/O rate(IOPS)
200
time
100
300
CL1-A
Graph 2: I/O rate displayed in Performance Monitor
(The Detail check box is not selected)
08:01 08:02
08:04
08:03
08:00
400
I/O rate(IOPS)
200
time
100
300
Ave.(1min.)
Min.(1min.)
Max.(1min.)
Graph 3: I/O rate displayed in Performance Monitor
(The Detail check box is selected)
08:01 08:02
08:04
Figure 2-3
Line Graphs Indicating Changes in Port Traffic
•
Note on using TrueCopy: Server Priority Manager monitors write I/O
requests issued from initiator ports of your storage system.