Viewing usage statistics on access paths, Viewing usage statistics on access paths -24 – Hitachi MK-96RD617-08 User Manual
Page 106
5-24 Performance
Monitor
Operations
Hitachi Universal Storage Platform V/VM Hitachi Performance Manager User’s Guide
Figure 5-11
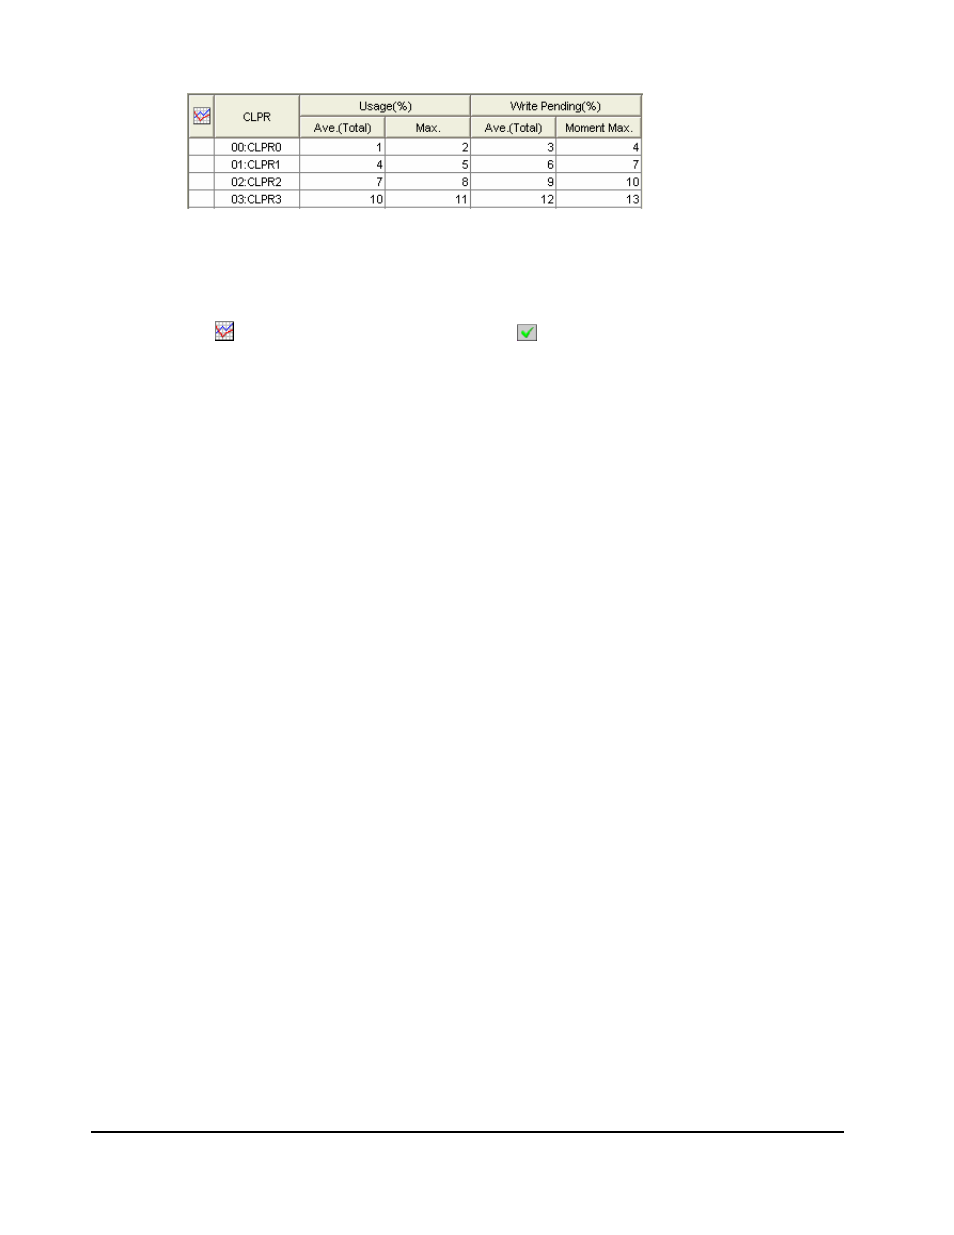
Example of Write Pending Rate and Cache Usage Rate
Displayed
The list displays the following items:
•
: When the green checkmark icon is displayed on the left of the write
pending rate, the graph illustrates changes in the write pending rate and
usage statistics about the cache memory.
•
CLPR: This column indicates numbers and names of cache logical partitions
(CLPRs) in the format "CLPR-number
:
CLPR-name". For details on CLPRs,
see the Virtual Partition Manager User's Guide.
•
Usage: This item is displayed only when you select shortrange for the
storing period of statistics.
–
The Ave. (Total) column displays the average usage rate of the cache
in the specified period.
–
The Max. column displays the maximum usage rate of the cache in the
specified period.
•
Write Pending:
–
The Ave. (Total) column displays the average write pending rate for
the specified period.
–
The Moment Max. column displays the maximum write pending rate
for the specified period.
Viewing Usage Statistics on Access Paths
The channel adapters (CHAs) and the disk adapters (DKAs) transfer data to
the cache switch (CSW) and the shared memory (SM) when I/O requests are
issued from hosts to the storage system. In some configurations, DKAs are
called array control processors (ACPs). Also, the cache switch transfers data to
the cache memory.
Performance Monitor audits these data transfer paths and lets you view the
average and the maximum usage rate for the paths in a specified period.
Performance Monitor also displays a graph illustrating changes in path usage
within that period.
To view usage statistics about paths:
1. Ensure that the Performance Management window is displayed.
2. In the tree, click the Physical tab.