Hitachi MK-96RD617-08 User Manual
Page 66
4-24
Using the Performance Manager GUI
Hitachi Universal Storage Platform V/VM Hitachi Performance Manager User’s Guide
•
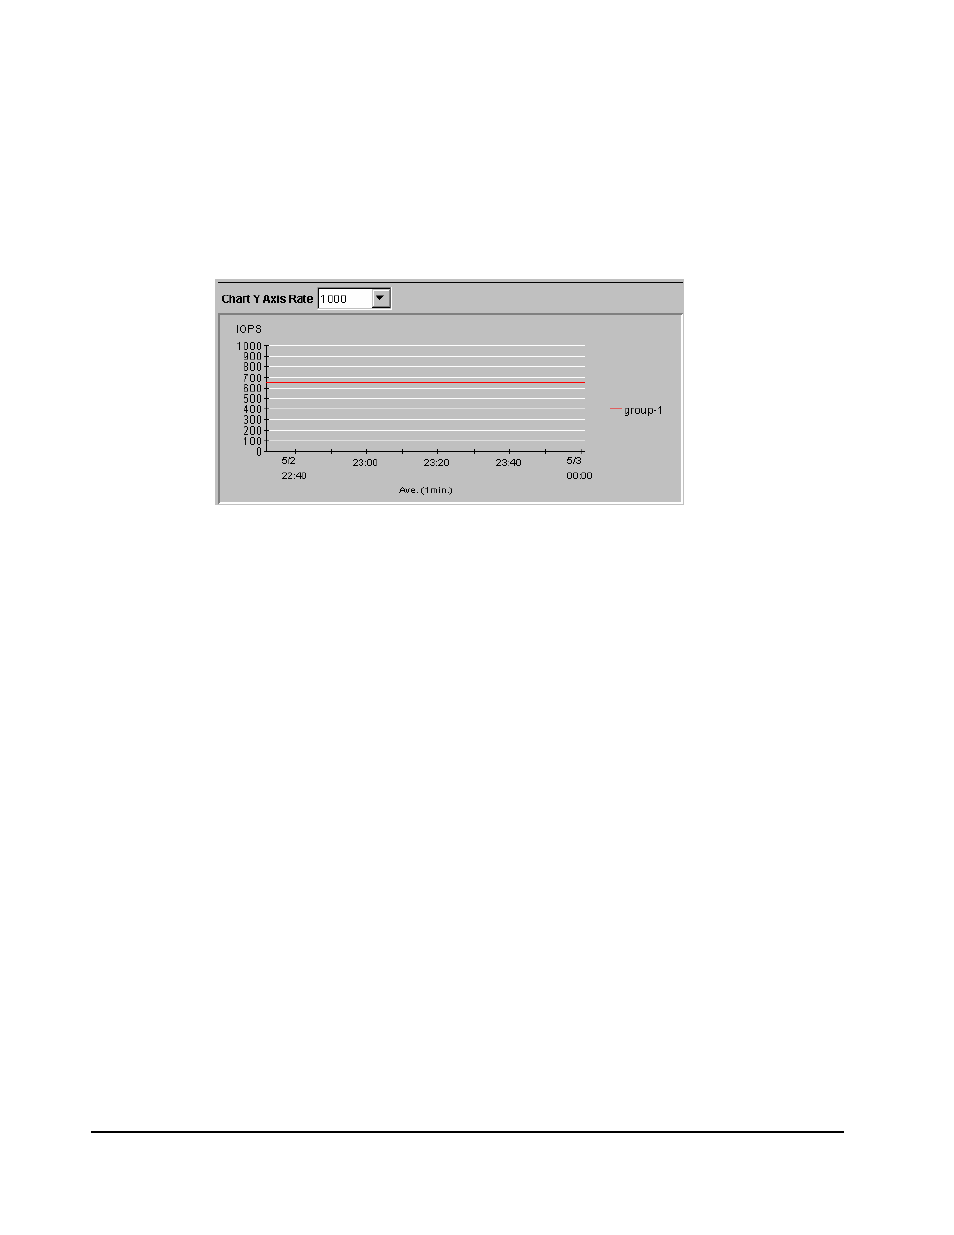
The line graph illustrates changes in the I/O rate or the transfer rate. The
vertical axis indicates the usage rates (in percentage). The horizontal axis
indicates dates and/or times.
When the graph displays I/O rates or the transfer rates for a host bus
adapter or an SPM group controlled by an upper limit, the graph also
displays a line that indicates the upper limit.
When you draw a graph, the Chart Y Axis Rate list lets you select the
highest value of the Y-axis (the vertical axis) of the graph.
Figure 4-12
Chart Y Axis Rate List, Detail Check Box, and the List to
Select the Item to be Displayed (Port-LUN tab)