Viewing usage statistics on disk processors, Viewing usage statistics on disk processors -19 – Hitachi MK-96RD617-08 User Manual
Page 101
Performance
Monitor
Operations
5-19
Hitachi Universal Storage Platform V/VM Hitachi Performance Manager User’s Guide
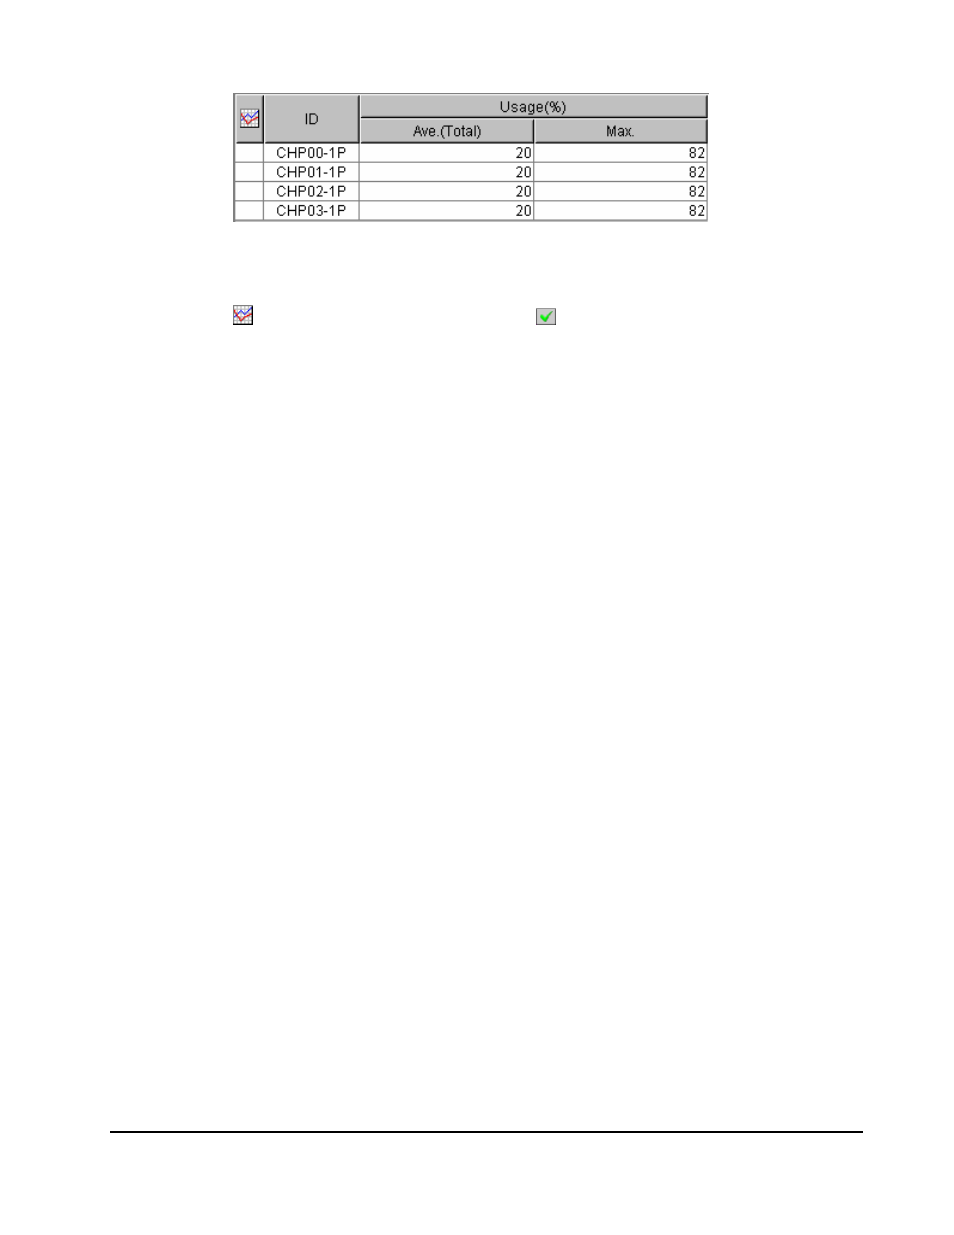
Figure 5-7
Example of Channel Processors Usage Rates Displayed
The list displays the following items:
•
: When the green checkmark icon is displayed on the left of a channel
processor, the graph illustrates changes in usage rate for the channel
processor.
•
ID: This column displays ID numbers for channel processors.
•
Usage:
–
The Ave. (Total) column displays the average usage rate in the
specified period.
–
The Max. column displays the maximum usage rate in the specified
period.
Viewing Usage Statistics on Disk Processors
Performance Monitor monitors disk processors (DKPs) and lets you view the
average and the maximum usage rate in a specified period. Performance
Monitor also displays a graph illustrating changes in disk processor usage
within that period.
To view usage statistics about disk processors:
1. Ensure that the Performance Management window is displayed.
2. In the tree, click the Physical tab.
3. In the list above the tree, select the storing period of statistics from
longrange and shortrange for display.
For details on the types of storing period of statistics, see Understanding
Statistical Storage Ranges.
When you view usage statistics about disk processors, the items displayed
in the list by selecting longrange and shortrange are the same.
4. In the tree, double-click the ACP folder.
5. Click DKP from below the ACP folder.
The list on the right displays usage statistics about disk processors. The
displayed statistics are the average and the maximum usage rates for the
period specified in the From and To boxes.