Hitachi MK-96RD617-08 User Manual
Page 117

Performance
Monitor
Operations
5-35
Hitachi Universal Storage Platform V/VM Hitachi Performance Manager User’s Guide
–
If you select a port (for example,
and ) in the tree, the list
displays I/O rates for all the host bus adapters connected to the
selected port=.
–
If you select a host group ( ) in the tree, the list displays I/O rates for
host bus adapters in the host group.
7. To display a graph to find out how the I/O rate has been changed, take the
following steps:
a. In the list, select one or more ports or host bus adapters (WWNs).
b. Click Draw.
Caution: If the graph does not display changes in the I/O rate (for
example, if the line in the graph runs vertically), it is recommended that
you change the value in the Chart Y Axis Rate list. For example, if the
largest value in the list is 200 and the value in Chart Y Axis Rate is 100,
you should select a value larger than 200 from Chart Y Axis Rate.
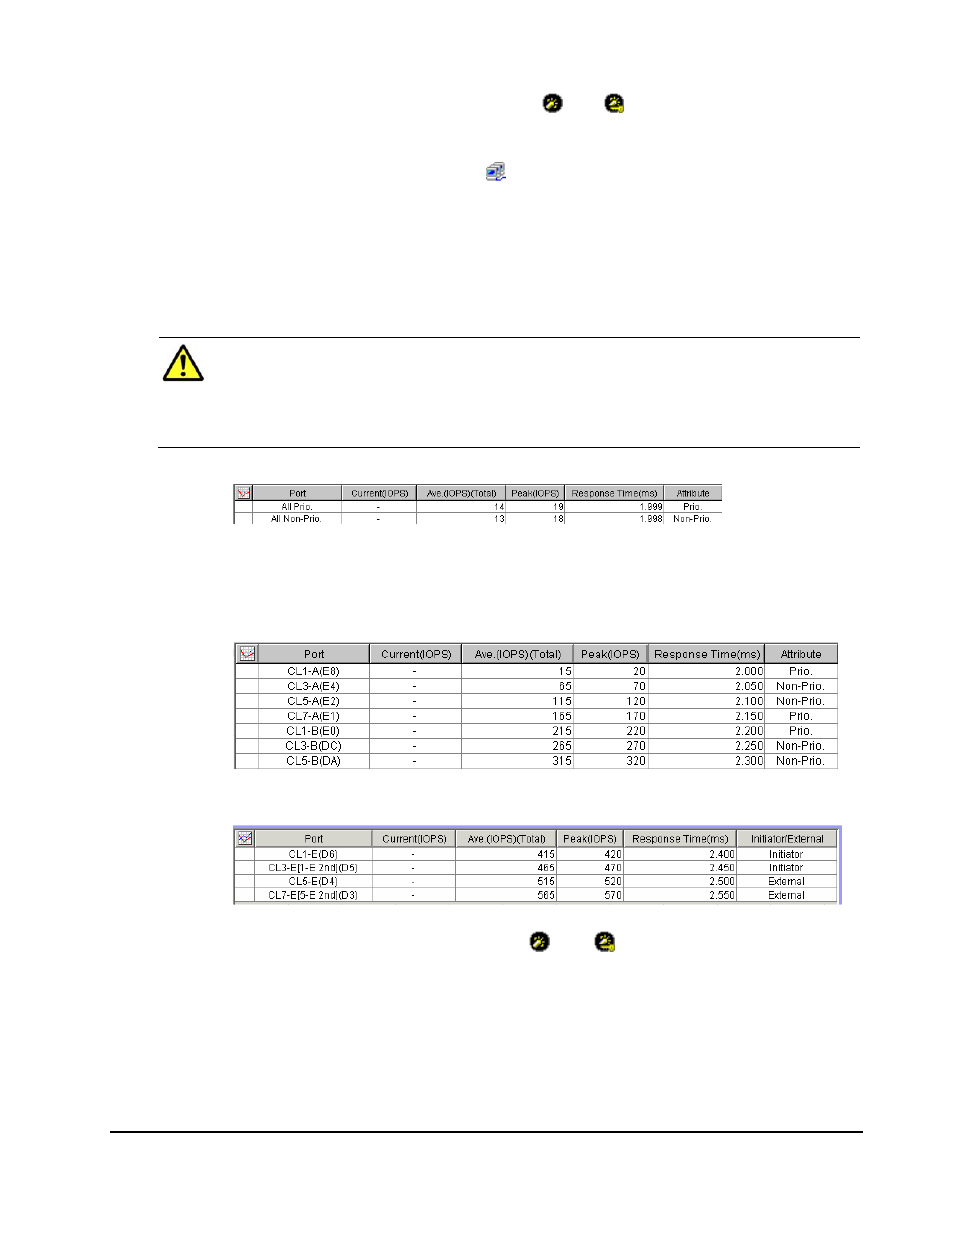
I/O rate for ports (When the Subsystem folder is selected):
All Prio. indicates
all the prioritized
ports.
All Non-Prio.
indicates all the
non-prioritized
ports
I/O rate for ports (When the Target folder is selected):
I/O rate for ports (When the Initiator/External folder is
selected):
I/O rate for host bus adapters connected to a specified port
(When a port ((for example,
and ) is selected):
