Hitachi MK-96RD617-08 User Manual
Page 55
Using the Performance Manager GUI
4-13
Hitachi Universal Storage Platform V/VM Hitachi Performance Manager User’s Guide
•
The line graph illustrates changes in the I/O rate, the transfer rate, etc.
The vertical axis indicates the usage rates (in percentage). The horizontal
axis indicates dates and/or times.
If you select connected parity groups in the tree, the graph illustrates
changes in disk access performance (e.g., the I/O rate and the transfer
rate) for all the connected parity groups.
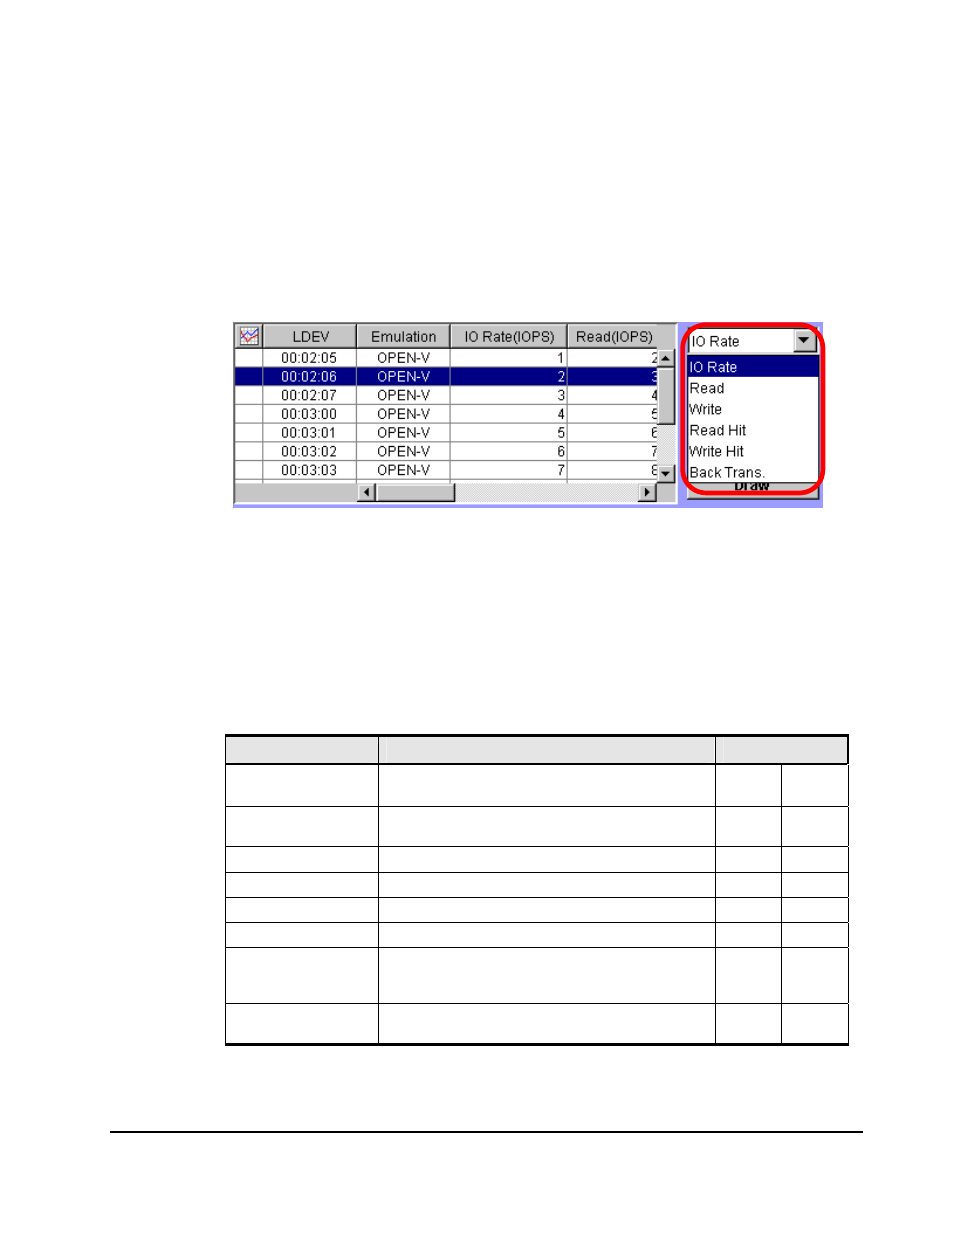
Before clicking Draw, use the list at the right corner of the list (just below
the list for specifying the type of statistics) to specify the type of
information that will be displayed in the graph. The list to specify the item
to be displayed is shown below.
Figure 4-6
Selecting an Item to be Displayed in the Graph (LDEV
Tab)
The items that can be selected in the list change depending on the type of
statistics you selected. Some items can be selected only when you select
I/O rate (IOPS) or the transfer rate (MB/s). The items you can select in
the list and the corresponding type of statistics are shown in Table 4-1.
Table 4-1
Items You Can Select in the List and the Types of Statistics
(LDEV Tab)
Type of statistics
Item selected in the
list
Meaning I/O
rate
transfer
rate
IO Rate
The I/O rate. The number of I/O accesses per
second).
9
Read
The number of read accesses per second.
9
Write
The number of write accesses per second.
9
Read Hit
The read hit ratio.
9
9
Write Hit
The write hit ratio.
9
9
Back Trans.
Backend transfer. The number of data transfers
between the cache memory and the hard disk
drive.
9
9
Trans.
The transfer rate. The size of data transferred per
second.
9
9: Can be selected (blank): Cannot be selected