Hitachi MK-96RD617-08 User Manual
Page 49

Using the Performance Manager GUI
4-7
Hitachi Universal Storage Platform V/VM Hitachi Performance Manager User’s Guide
–
N/M list: The N displays the number of the current page. The M
displays total number of pages. Use the list to choose the number of the
page to display.
–
Next button allows you to display the next 4,096 resources.
•
The Volume Migration button starts the Volume Migration if that program
is enabled and longrange is specified for the display range. Volume
Migration lets you optimize hard disk drive performance. For information on
using Volume Migration, contact the Hitachi Data Systems Support Center
(see Calling the Hitachi Data Systems Support Center.
•
The Draw button displays a line graph illustrating changes in usage
statistics. The graph can display up to eight lines simultaneously.
•
The line graph illustrates changes in usage statistics. The vertical axis
indicates the usage rates (in percentage). The horizontal axis indicates
dates and/or times.
If you select connected parity groups in the tree, the graph displays
changes in usage statistics for all the connected parity groups.
When you illustrate a graph of the following information with specifying
shortrange, you can select an item to be displayed in the graph from the
list on the upper-right of the graph:
–
Information of external volume groups or external volumes.
–
Information of cache memory (write pending rates or usage statistics
about cache memory).
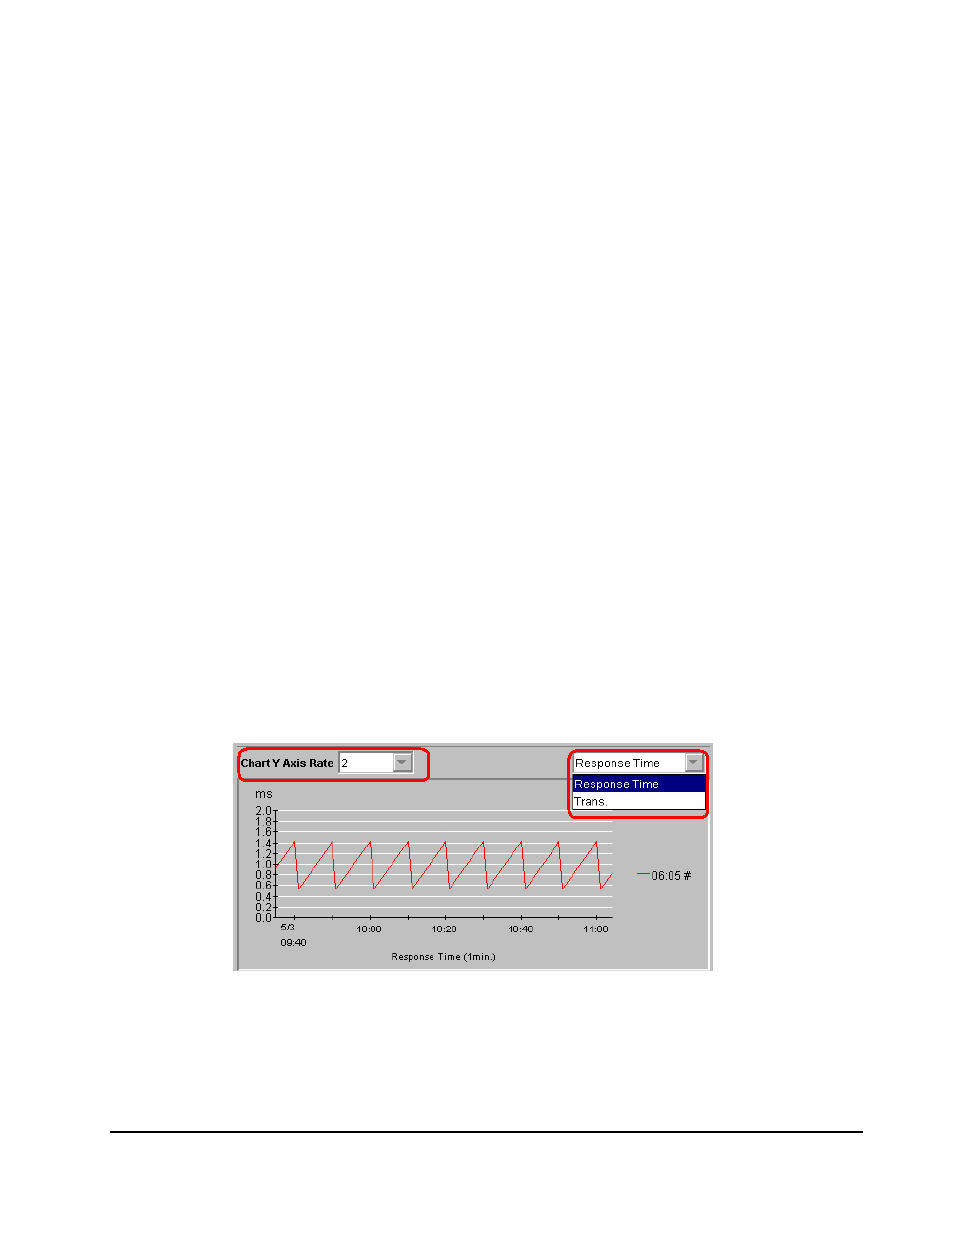
In addition, when you display information of external volume groups or
external volumes, you can select the highest value of the Y-axis (the
vertical axis) of the graph at the Chart Y Axis Rate list on the upper left
of the graph.
Figure 4-4 shows how to select an item displayed in the graph and how to
select the highest value of the Y-axis.
Figure 4-4
Selecting an Item Displayed in the Graph and the Highest
Value of the Y-Axis (Physical Tab)
