Hitachi MK-96RD617-08 User Manual
Page 118
5-36 Performance
Monitor
Operations
Hitachi Universal Storage Platform V/VM Hitachi Performance Manager User’s Guide
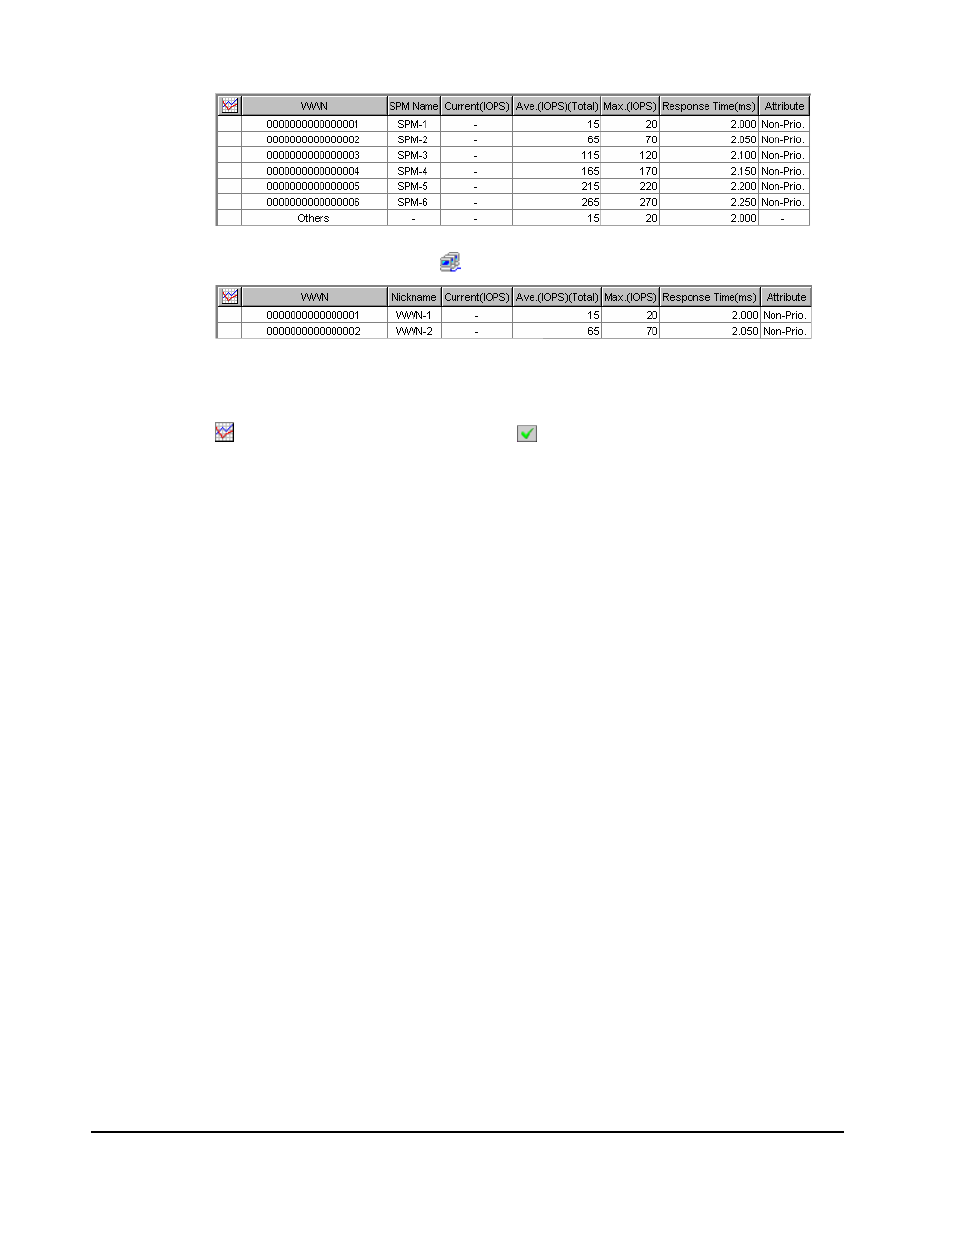
I/O rates for host bus adapters in a host group
(When a host group ( )is selected):
Figure 5-15
I/O Rates for Ports
The list displays the following:
•
: When the green checkmark icon is displayed on the left of an item,
the graph displays changes in workload statistics about the item.
•
Port: Indicates ports on the storage system.
•
WWN: Indicates WWNs of the host bus adapters.
•
SPM Name: Indicates SPM names of the host bus adapters. Server Priority
Manager allows you assign an SPM name to each host bus adapter so that
you can easily identify each host bus adapters in the Server Priority
Manager windows.
•
Nickname: Indicates the nickname for the host bus adapters. LUN
Manager allows you to assign a nickname to each host bus adapter so that
you can easily identify each host bus adapter in the LUN Manager windows.
•
Current: Indicates the current I/O rate.
•
Ave.: Indicates the average I/O rate for the specified period.
•
Peak: Indicates the peak I/O rate of the ports for the specified period. This
value is shown in the list when you select the Subsystem folder in the tree.
If you select a port in the list, click Draw, and select the Detail check box,
the detailed graph of the port I/O rate is drawn. The Peak value means the
top of the Max. line in this graph.
•
Max.: Indicates the maximum I/O rate for the specified period. This value
is shown in the list when you select a port icon or host group icon in the
tree.
•
Response Time: This column indicates the time for replying from the port
or host bus adapter when I/O accesses are made from the host to them.
The unit is milliseconds. The average response time in the period specified
at Monitoring Term is displayed.
•
Attribute: Indicates the priority of each port. Prio. indicates a prioritized
port. Non-Prio. indicates a non-prioritized port.