Hitachi MK-96RD617-08 User Manual
Page 91

Performance
Monitor
Operations
5-9
Hitachi Universal Storage Platform V/VM Hitachi Performance Manager User’s Guide
5. To display a graph illustrating changes in usage rate for parity groups,
select the desired parity groups in the list and then click Draw.
Note: The range of monitoring and the gathering interval affects the time
period represented by a graduation on the horizontal axis.
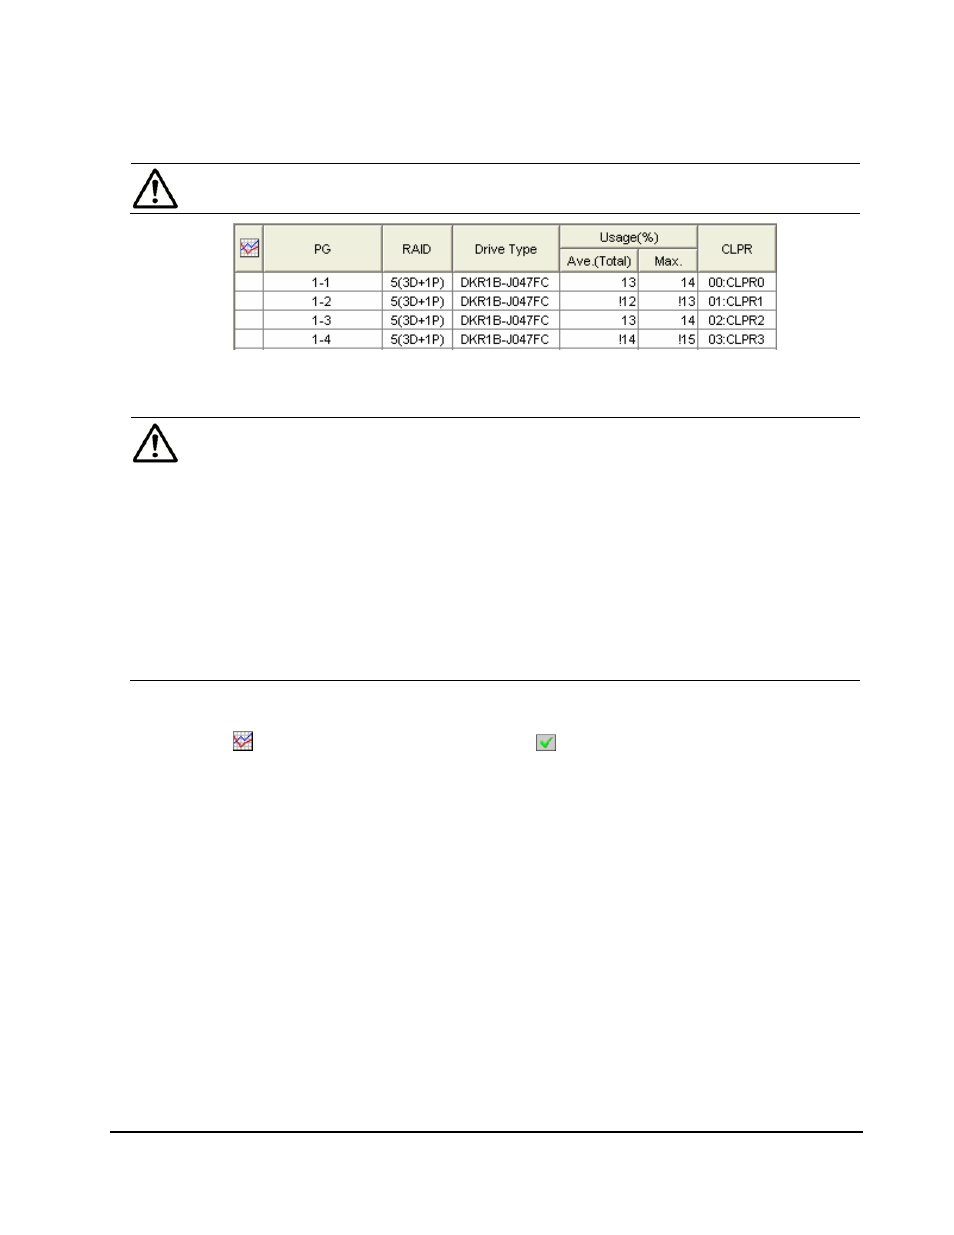
Figure 5-3 Example of Parity Group Usage Rates Displayed in the List
Notes:
• It is possible that the usage rate for a parity group is not equal to the
sum of the usage rate for each volume in that parity group (see Viewing
Usage Statistics on Volumes in Parity Groups). This is because the
Performance Management window rounds off fractions below the
decimal point to the nearest whole number when displaying the usage
rate for each volume.
• If there is no volume in a parity group, hyphens(-) are displayed in
place of performance statistics on a parity group.
• If the CU is not the monitoring target, all items in the row are displayed
in italics. If you want to monitor those items, specify the CU as the
monitoring target by using the Monitoring Option window.
The list displays the following items:
•
: When the green checkmark icon is displayed to the left of a parity
group, the graph illustrates changes in usage rate for the parity group.
•
PG: This column indicates IDs of parity groups.
•
RAID: This column indicates the RAID level (RAID-1, RAID-5, or RAID-6).
•
Drive Type: This column indicates types of HDDs (hard disk drives).
•
Usage:
–
The Ave. (Total) column displays the average usage rate in the
specified period.
–
The Max. column displays the maximum usage rate in the specified
period.
•
CLPR: This column indicates numbers and names of cache logical partitions
(CLPRs) corresponding to each parity group in the format "CLPR-
number
:
CLPR-name". For details on CLPRs, see the Virtual Partition
Manager User's Guide.
