Adding a service, Data line monitor configuration table, Adding a service -15 – Verilink WANsuite 5370 (34-00310.D) Product Manual User Manual
Page 45: Data line monitor configuration table -15
W e b S e r v e r I n t e r f a c e
3-15
Figure 3.12
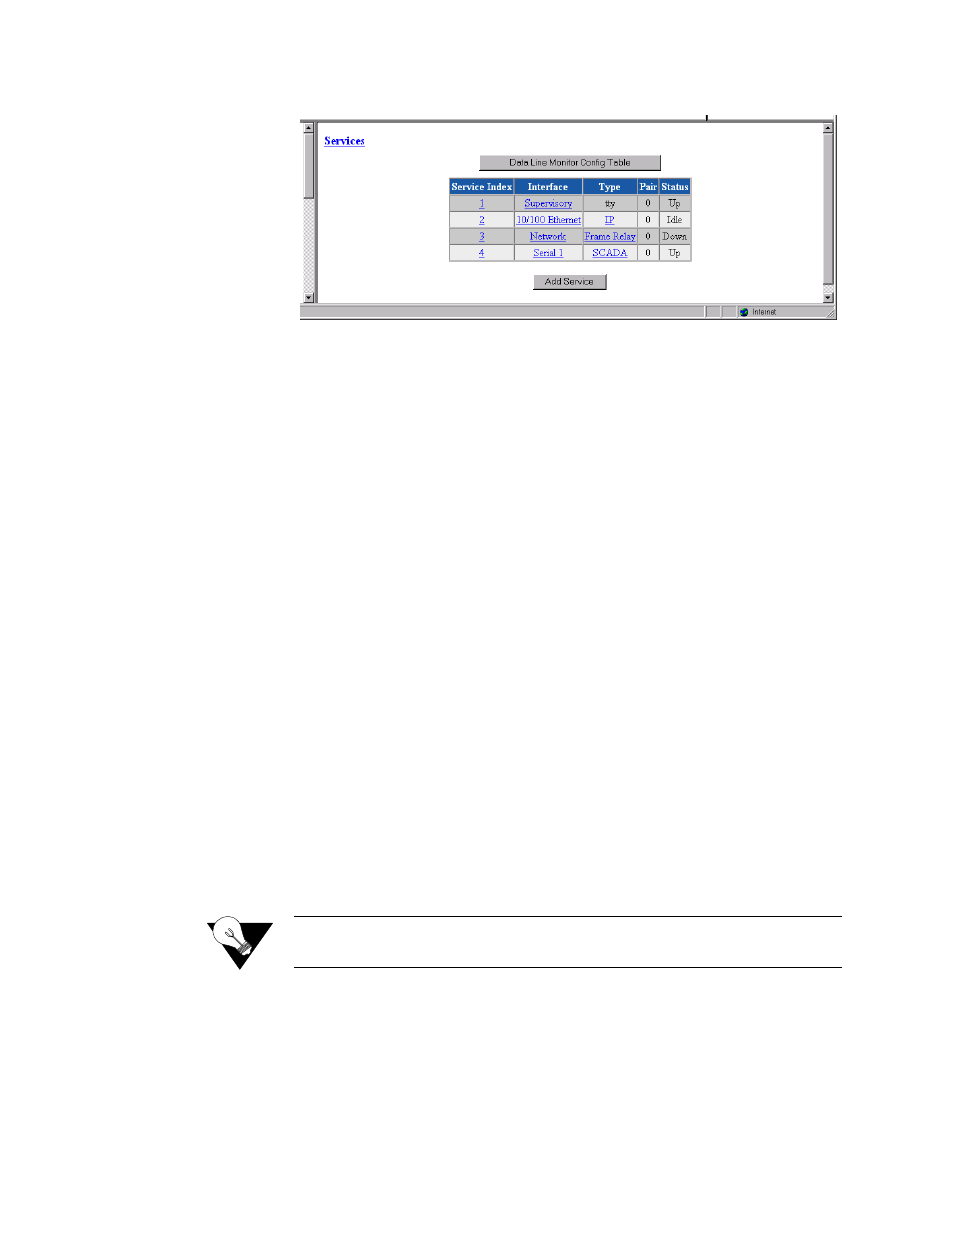
Services Screen
The Status for a particular service will display as one of the following:
•
Dead
−
The service is not functional because required resources are not
available.
•
Changed
−
The service parameter was changed and a Save and Restart is
required for the service to function.
•
Down
−
The service is not able to pass data because the physical layer is
down.
•
Physical Up
−
The service is not able to pass data because it has not
completed any required negotiations.
•
Up
−
The service is ready to pass data.
•
Idle
−
The service has nothing to do.
The table in the center of the screen displays the available services listed by
index number. To view more detailed information about a service, click on
the index number associated with the desired service on the above screen and
then click on one of the user-activated “Details” buttons on the Service
Details screen as described below.
Adding a Service
To add a service, begin by clicking the “Add Service” button on the Services
screen. A new service listed by the next incremental index number will appear
on screen. The Interface for the newly added service will be “Unassigned.” To
assign an interface for the new service, click on its index number, which will
take you to the Service Details screen as described under Service Details
Screen on page 3-17.
NOTICE:
Any changes to settings on the Services screen require a “Save and
Restart” for them to take effect.
Data Line Monitor Configuration Table
Click on the Data Line Monitor Config Table button at the top of the Service
screen to view a screen that displays SCADA port information (Figure 3.13).