Graphical display of the measured values, 1 setting the sampling rate – BINDER KT 53 User Manual
Page 99
KT (E6) 09/2013
Page 99/135
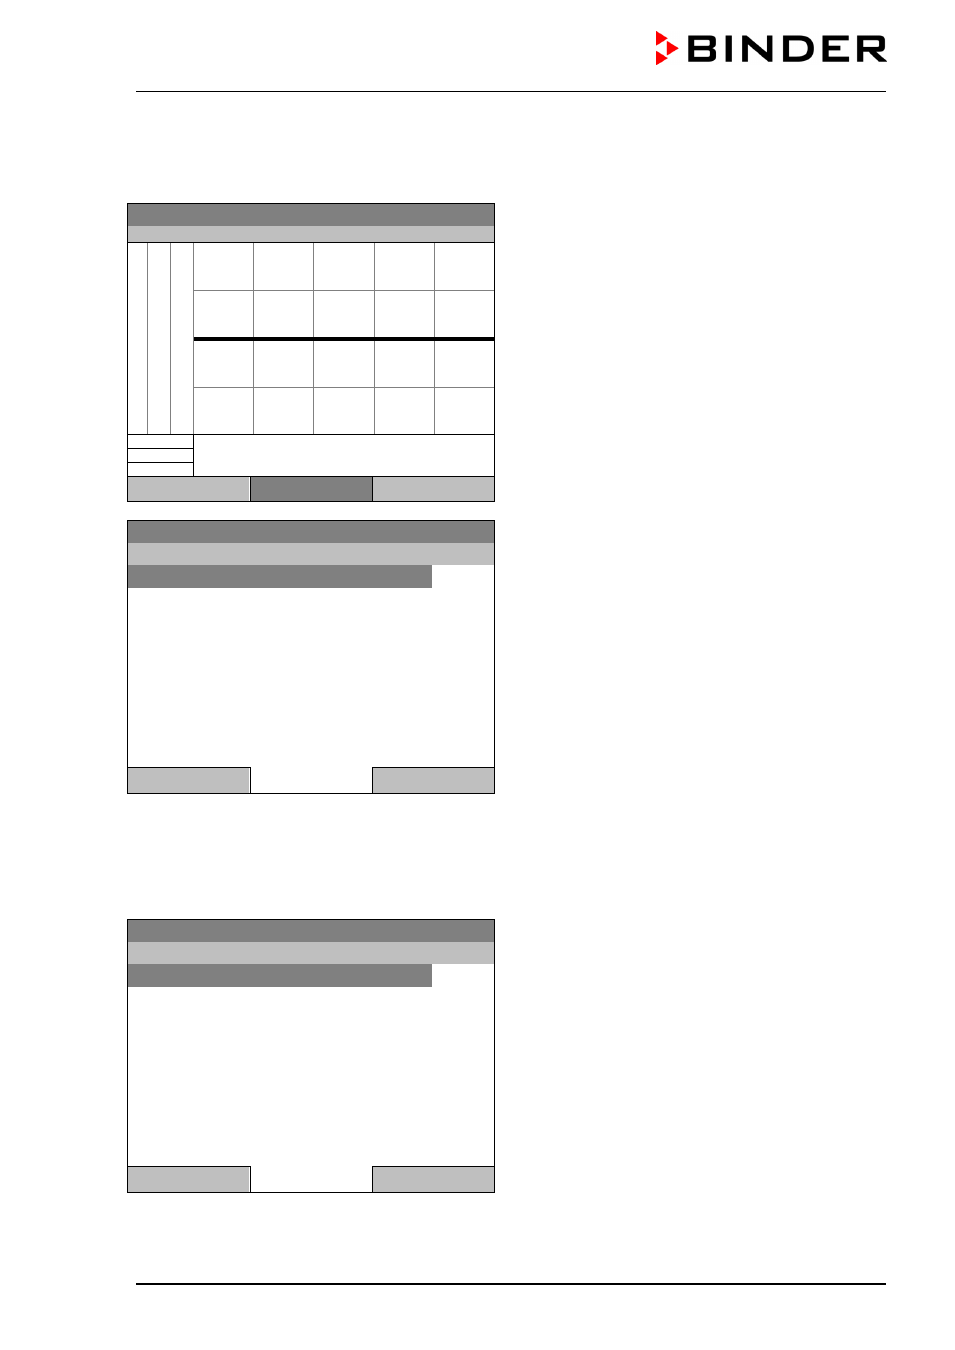
16. Graphical display of the measured values
To access the graphical display, go to
Menu > Measurement chart
Fixed value
08.03.2013 05:05:06
Measurement chart view.
(sample view with optional unit equipment)
Press the “Settings” button.
0:0
0:5
0:11
0:16
0:22
Tem
pe
ra
tur
e
S
af
et
y
co
nt
rol
le
r t
em
pe
ra
tur
e
D
oor
te
m
pe
rat
ur
e
Output 1
---------------------------------------------------------------------
Output 2
---------------------------------------------------------------------
Output 3
---------------------------------------------------------------------
Close
Settings
Home
Fixed value
08.03.2013 05:05:06
Submenu “Settings”.
Select the desired function
and press the operating button.
Settings
Sampling rate
Display range
Parameters
Close
Home
16.1 Setting the sampling rate
To define the sampling rate, go to
Menu > Measurement chart > Settings > Sampling rate
Fixed value
08.03.2013 05:05:06
Submenu “Sampling rate”.
Select the desired interval
and press the operating button.
Sampling rate
Five seconds
Ten seconds
One minute
Five minutes
Ten minutes
Close
Home