Brookfield DV3T Rheometer User Manual
Page 43
Brookfield Engineering Labs., Inc.
Page 43
Manual No. M13-2100
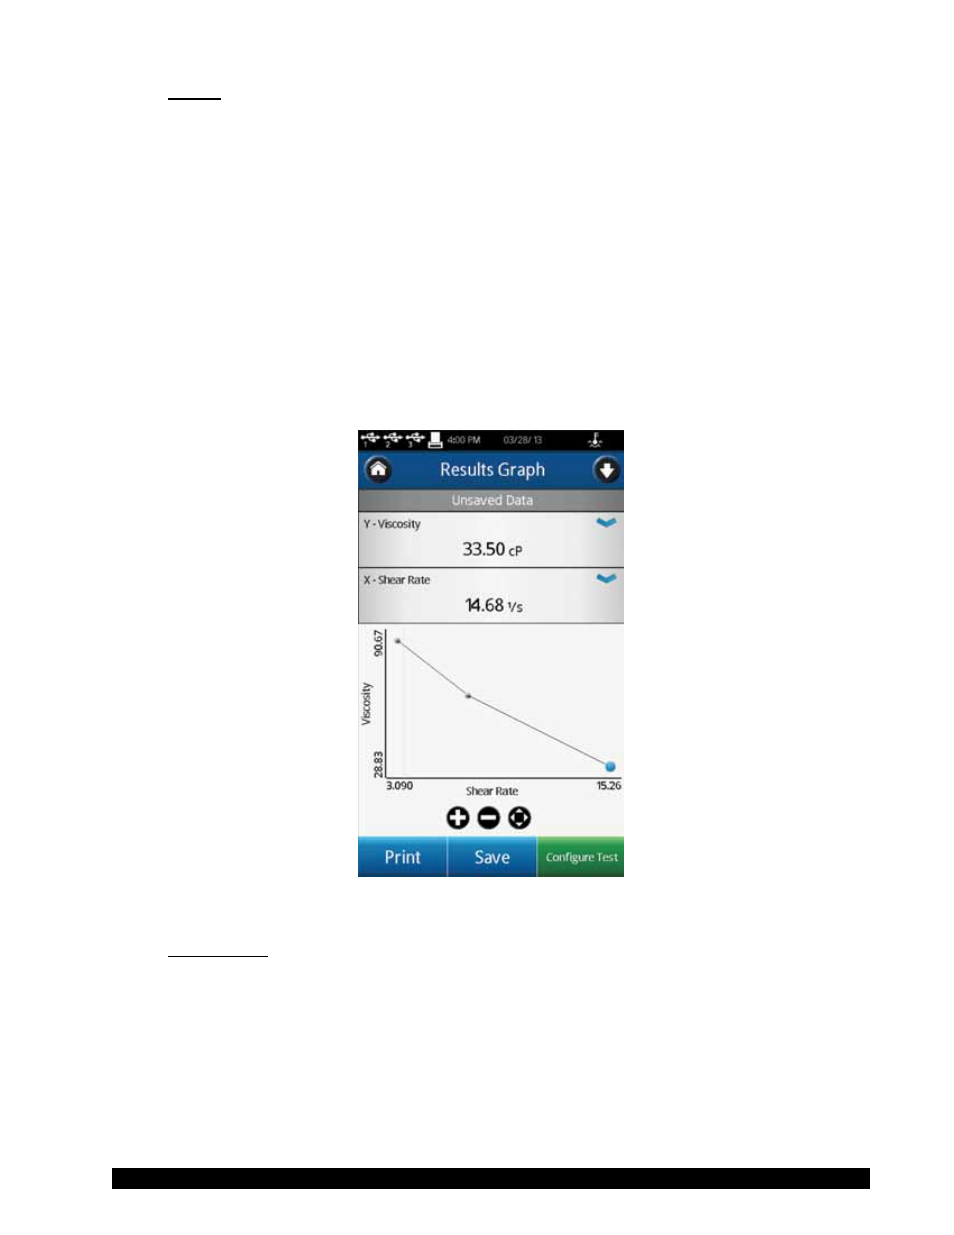
Graph: Display a graph of the collected data. The axis will default to the values selected in the
Report section of the Test. The value displayed on each axis can be changed by selecting
from the blue drop down arrow in each field. Individual data points can be selected
and the X / Y coordinate values will be displayed. The selected point is represented
by a blue dot (other points are shown as grey dots).
TIP: Some spindle selections do not allow for the calculation of shear stress and
shear rate. Shear Stress and Shear rate will be represented as zero for all data
points for this type of spindle.
TIP: If the temperature probe is not connected to the DV3T, then the temperature
field will not contain any data. The Graph will not display temperature under
this condition.
The Graph can be printed if there is an attached printer. The buttons at the bottom of
the graph are for zooming in, zooming out, and resetting.
Figure III-18
Math Model: Analyze collected data through several defined equations. The selected math
model will default to the selection from the Report section of the Test. You can
change the selected model by pressing the blue drop down arrow.
Math Models available on the DV3T Rheometer include Bingham, Casson,
NCA/CMA Casson, Power Law, IPC Paste, and Thix Index. Each Math Model
will be displayed in equation form with parameter values and confidence of fit
calculations shown. Additionally, a graph of the model will be shown when
available (no graph is available for Thix Index). The graph is a visual aid only
and will not be included with a print.