4 work with the averages view, Averages view, Work with the averages view – Welch Allyn CardioPerfect Workstation Exercise ECG Module - User Manual User Manual
Page 31
CardioPerfect Workstation
Exercise ECG Module - User Manual
DIR 80012335 Ver. E
31 / 83
Trends and Graphs
ST table
An overview of the ST values as calculated in the ST table
view.
Heart rate trend
The heart rate trend as calculated in the Heart rate view.
ST trend
The ST value chart of a predefined lead
Blood pressure
The blood pressure, heart rate and corresponding rate
pressure product.
3.4
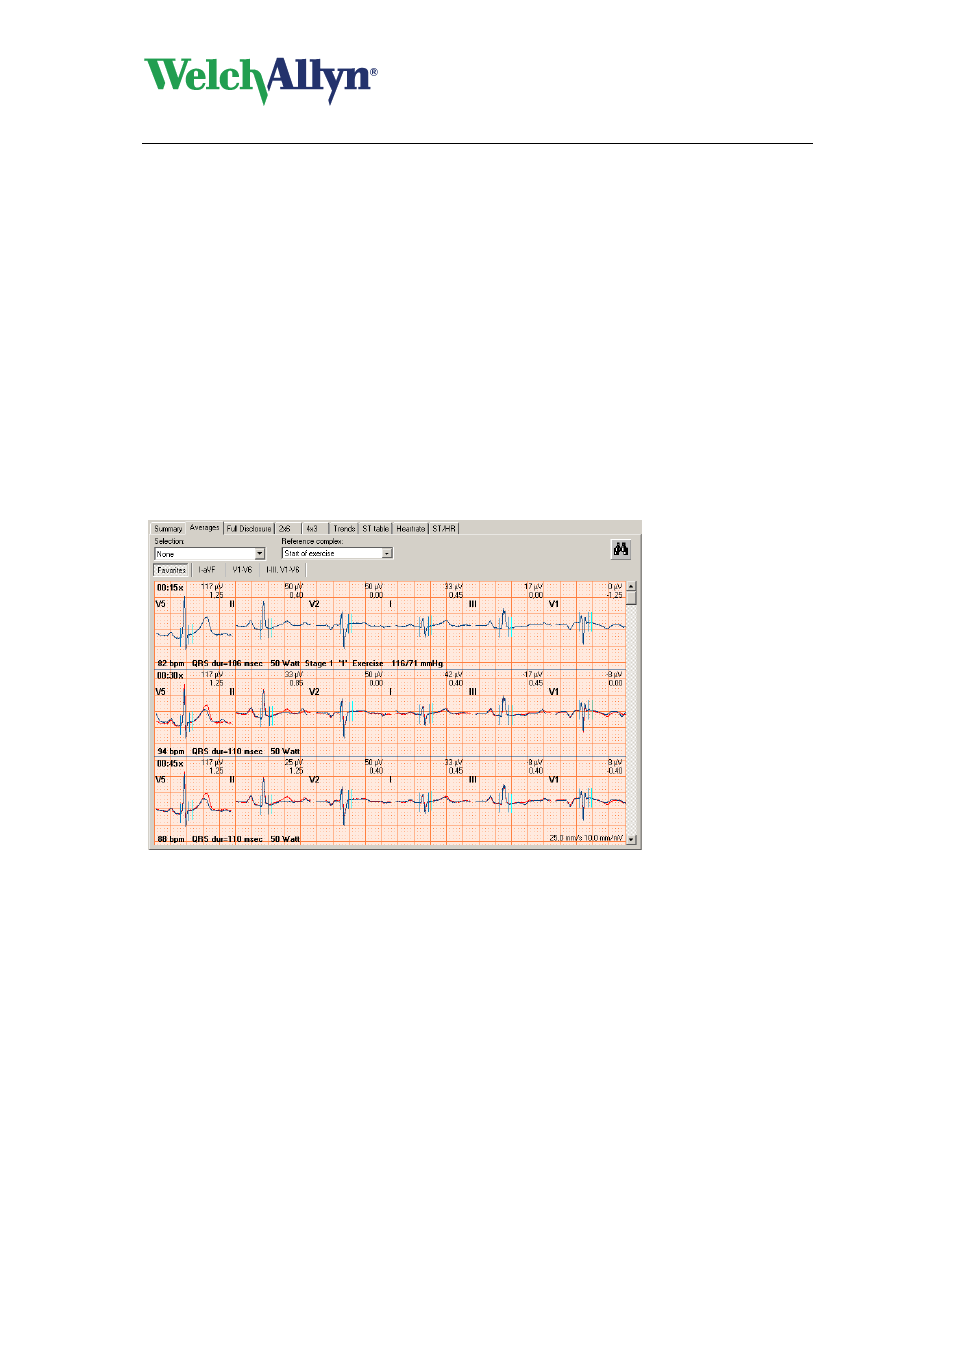
Work with the Averages view
3.4.1.
Averages view
The Averages view displays the averaged complexes at a number of given points in the
exercise ECG. These points usually are the ends of each stage, and points of interest, such
as the highest ST deviation. See section 7.2.1 for more details about configuring Selections.
For each point, the averaged complexes of six leads are displayed, together with the patient's
heart rate, the QRS duration, the workload (in case of an ergometer test) or speed and
elevation (in case of a treadmill test), the phase and the blood pressure. The ST levels and
slopes are displayed above the complexes.
To select which six leads you want to view:
1. Click the I-aVF button to display the averages of leads I to aVF.
2. Click the V1-V6 button to display the averages of leads V1 to V6.
3. Click the I-III,V1-V6 button to display the averages of leads I to V6.
4. Click the Favorites button to display the lead preference that was set in the exercise
ECG settings.
To display multiple rows with averaged complexes:
1. Click the right mouse button on the view to display the contextual menu.
2. Click Number of Rows. The Rows dialog box is displayed.
3. Enter the number of rows you want to see.