Figure 89 example, markers tab, Limits 1 tab, Figure 90 example, limits 1 tab – Bird Technologies SH-362S-Manual User Manual
Page 129: Limits 2 tab, Limits 1 tab limits 2 tab
107
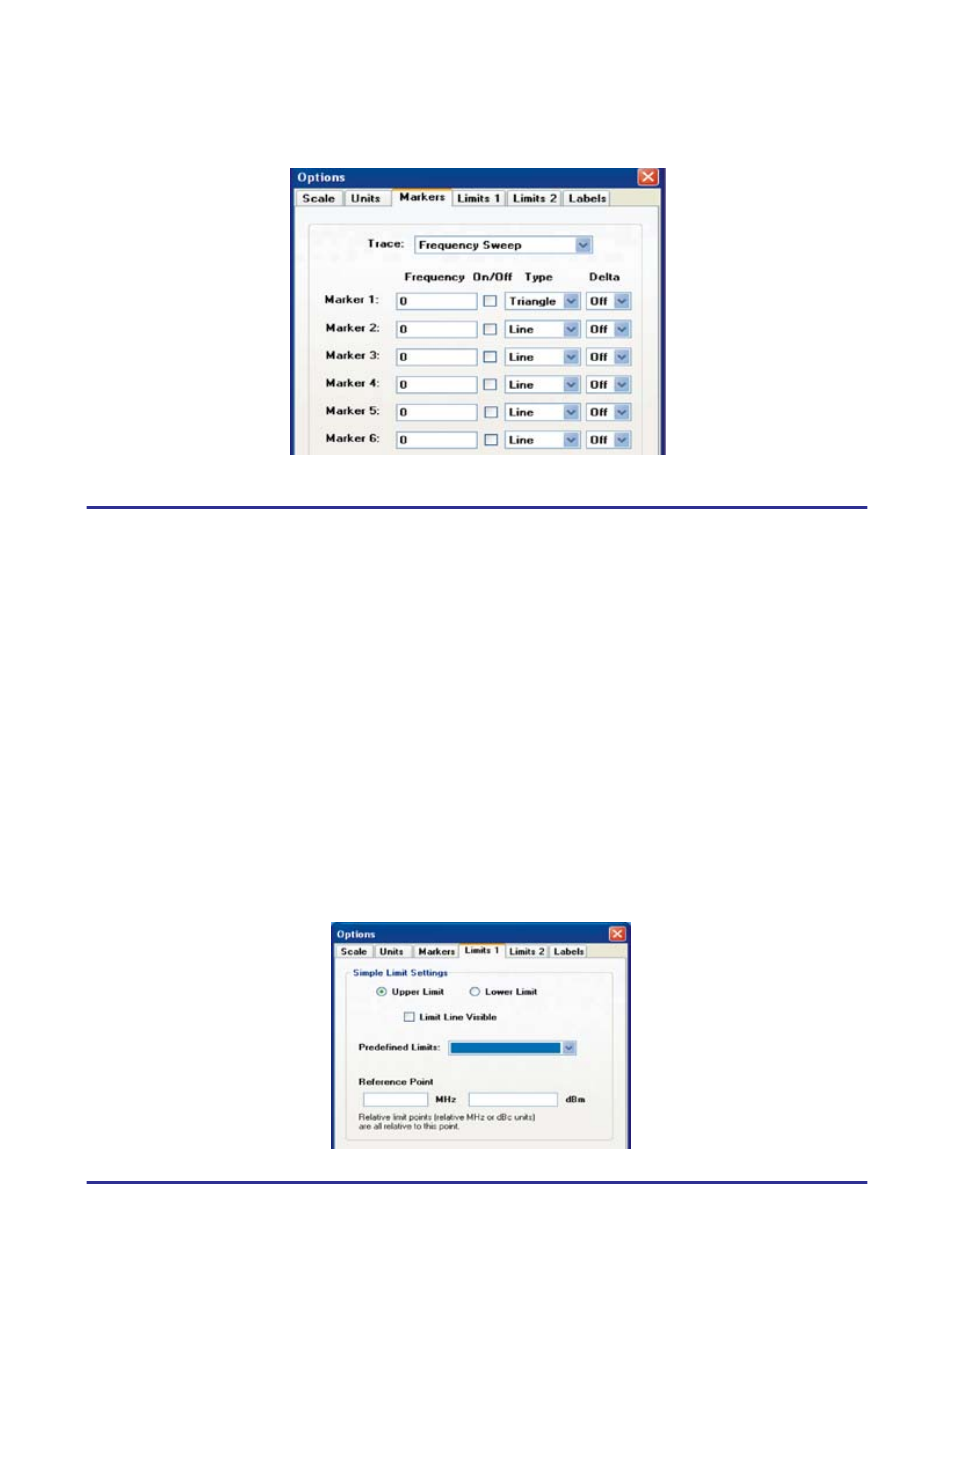
Figure 89 Example, Markers Tab
Limits 1 Tab
Defines and turns on or off upper/lower limit lines.
Note:
The options displayed on this tab will change slightly depend-
ing on the type of graph opened.
Note:
The upper limit fails any datapoints that are above the line.
Note:
The lower limit fails any datapoints that are below the line.
Note:
The limit line will be flat across the graph at the power level
specified.
1.
Click on the line
2.
Drag the line to move it up and down.
Note:
There is a drop down menu of predefined limits that is avail-
able to be utilized.
Figure 90 Example, Limits 1 Tab
Limits 2 Tab
Note:
The options displayed on this tab will change slightly depend-
ing on the type of graph opened.
Note:
The upper limit fails any datapoints that are above the line.
Note:
The lower limit fails any datapoints that are below the line.
Note:
Up to thirty points, for both upper and lower limit lines can be
set up. Using multiple points, a bracketed area may be created.