9 view menu, 1 process, ratio, readings, 2 graph selection – INFICON Guardian EIES Controller User Manual
Page 90
3 - 38
IP
N 07
4-
51
7-
P1
D
Guardian Co-Deposition Controller Operating Manual
3.9 View Menu
3.9.1 Process, Ratio, Readings
The Process, Ratio and Readings menu items are described at
and
, respectively.
The check mark indicates which one is active. Click on the title to select that
display. In addition, four graphs may be viewed as described below.
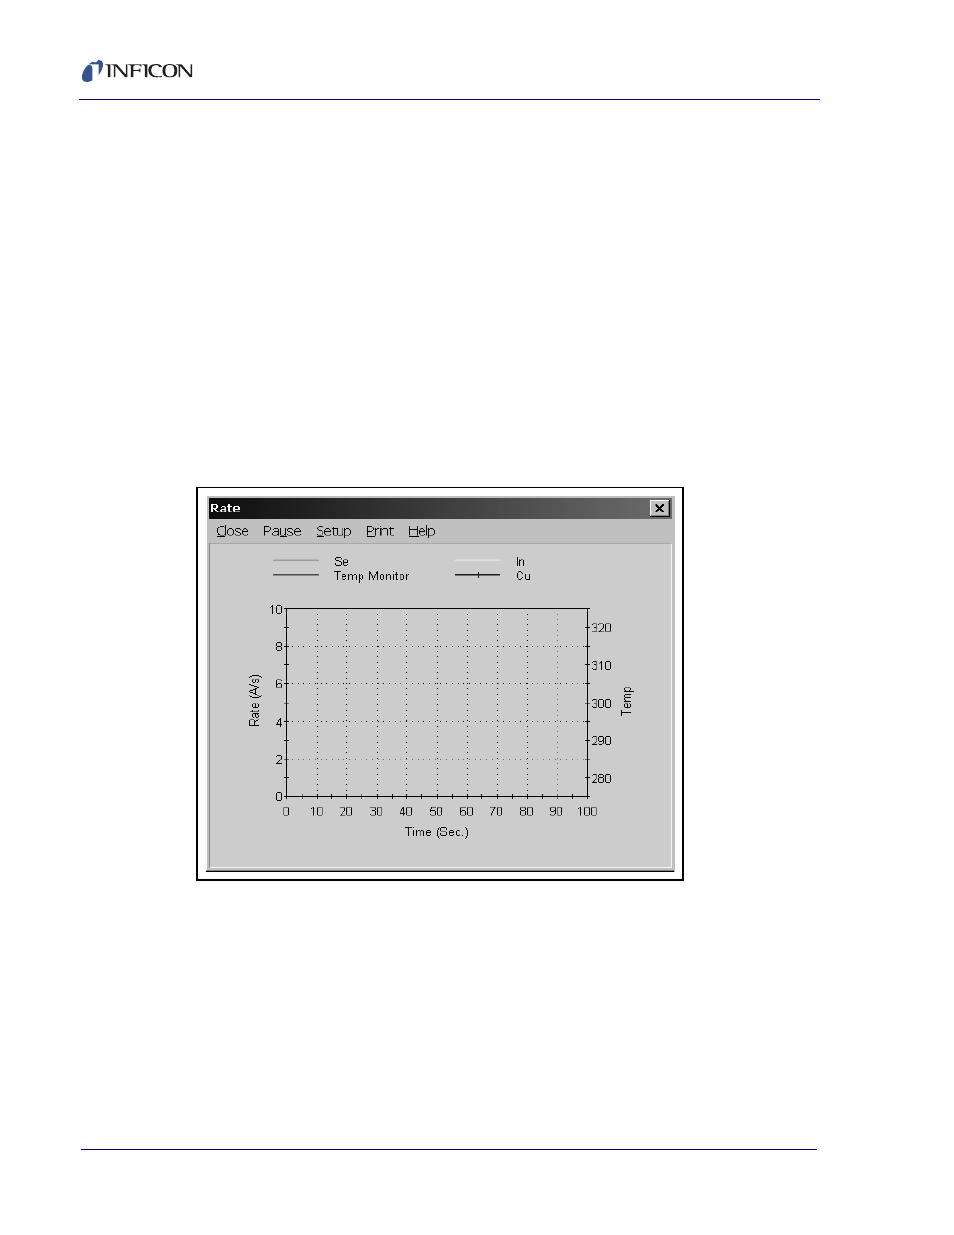
3.9.2 Graph Selection
The EIES program supports four independent graphs. Initially they are shown on
the View menu as 1. Rate (see
), 2. Deviation, 3. Power, and
4. Total. The titles may be changed.
To size a graph, click and drag the form's border. The size and location are
automatically stored on exit from the program.
Figure 3-30 Rate Graph
Close: Closes the selected graph display.
Pause/Run: Click pause to temporarily stop the graph from displaying data. Click
Run to resume graphing.
Setup: The graph's name and data, as well as many other setup parameters, can
be changed on the Graph Setup screen. Graph setup is detailed in
Print: Prints the graph to the system printer.
Help: Displays the graph help screen.