Statistics from drying process reports – RADWAG MA 200.3Y Moisture Analyzer User Manual
Page 101
- 101 -
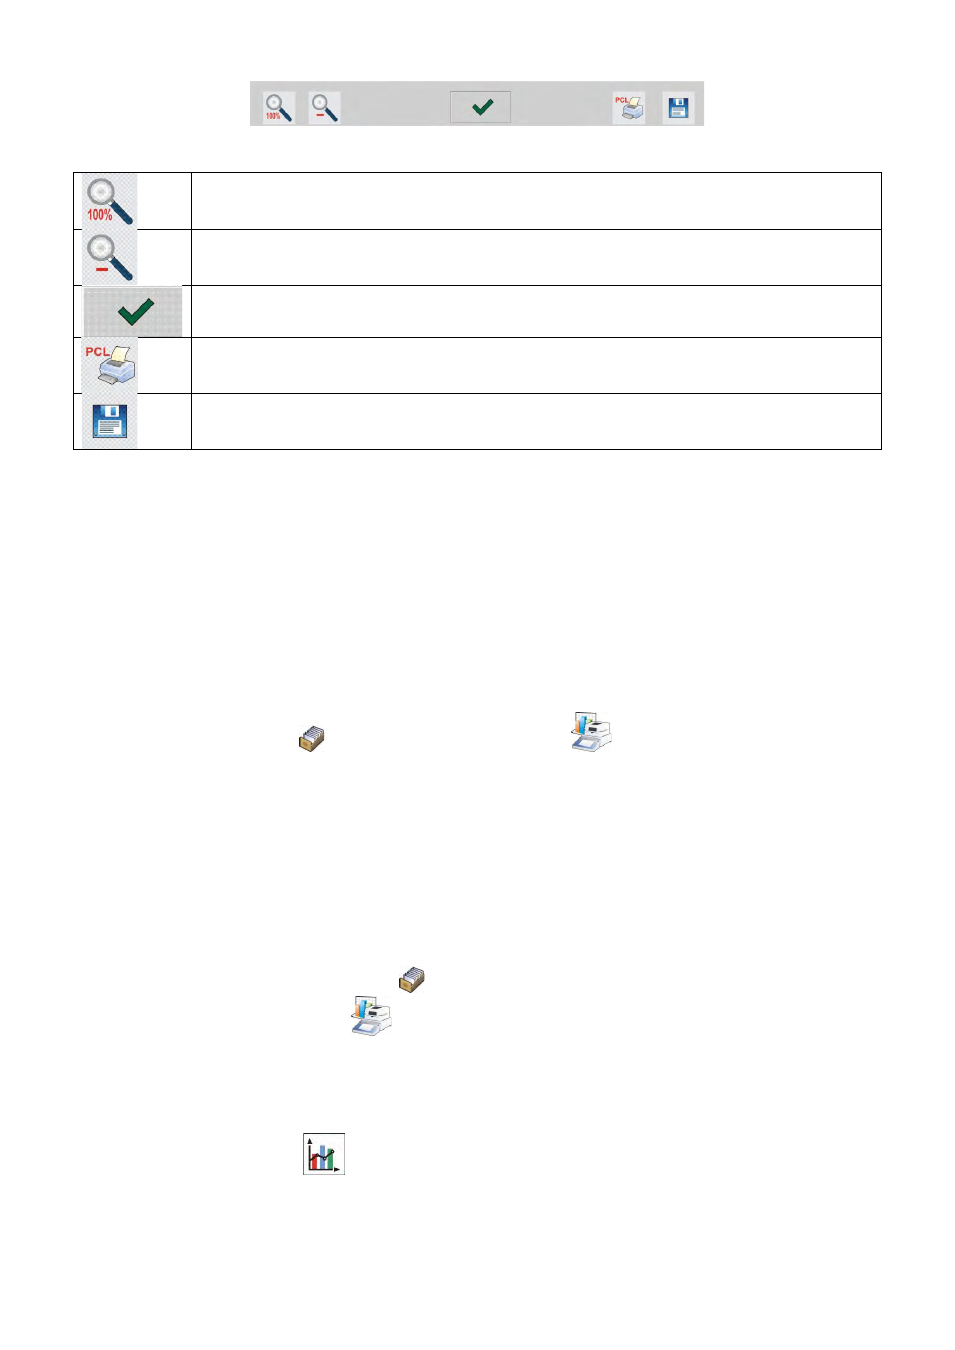
The bottom bar contains the following soft keys (options):
Return to displaying the complete chart
Reducing the screen to the previous view
Return to displaying the previous window
Printing the chart on a connected printer PCL type
Saving the chart as a file in format *.bmp on an external data
storage device connected to terminal’s USB port.
19.7. Statistics from drying process reports
The menu option enables previewing history of completed drying processes of a
specific product. Processes available for each product from the database:
previewing reports for each of drying processes, generating charts with obtained
humidity content for all tested samples of a product, printing and exporting data
on completed drying processes.
Procedure
•
Enter submenu < Databases>, and press <
Statistics of reports from
drying process>
•
Select product, for which history of tests should be generated
•
Determine searching criteria for displaying data (start date and end date)
•
Display list of drying reports complying with accepted searching criteria
(product, completion date)
•
Generate a chart from the course of selected drying process completed drying processes>. Procedure of generating a chart from completed measurements: • Enter submenu < Databases>, • Press field < Statistics of reports from drying process > • Select product for which history of completed tests should be generated • Determine searching criteria for displaying data (start date and end date) • Press < Charts from completed drying processes > key The software automatically generates and previews (in the coordinate system of: Result/Measurement no.) a chart containing data on completed drying process.