Viewing port statistics, Accounting, Total received frames – Allied Telesis AT-S20 User Manual
Page 107: Figure629 total received frames per port graph, Figure630 received frames graph for port 1, Viewing port statistics -33, 9lhzlqj#3ruw 6wdwlvwlfv
AT-S20 User’s Guide
6-33
9LHZLQJ#3RUW
6WDWLVWLFV
1. Select
Ethernet statistics
, then select
Receive
Statistics Graph
.
2. Select
Individual port overview
to display a screen
similar to Figure 6-29, listing each port and the corresponding
total number of frames received:
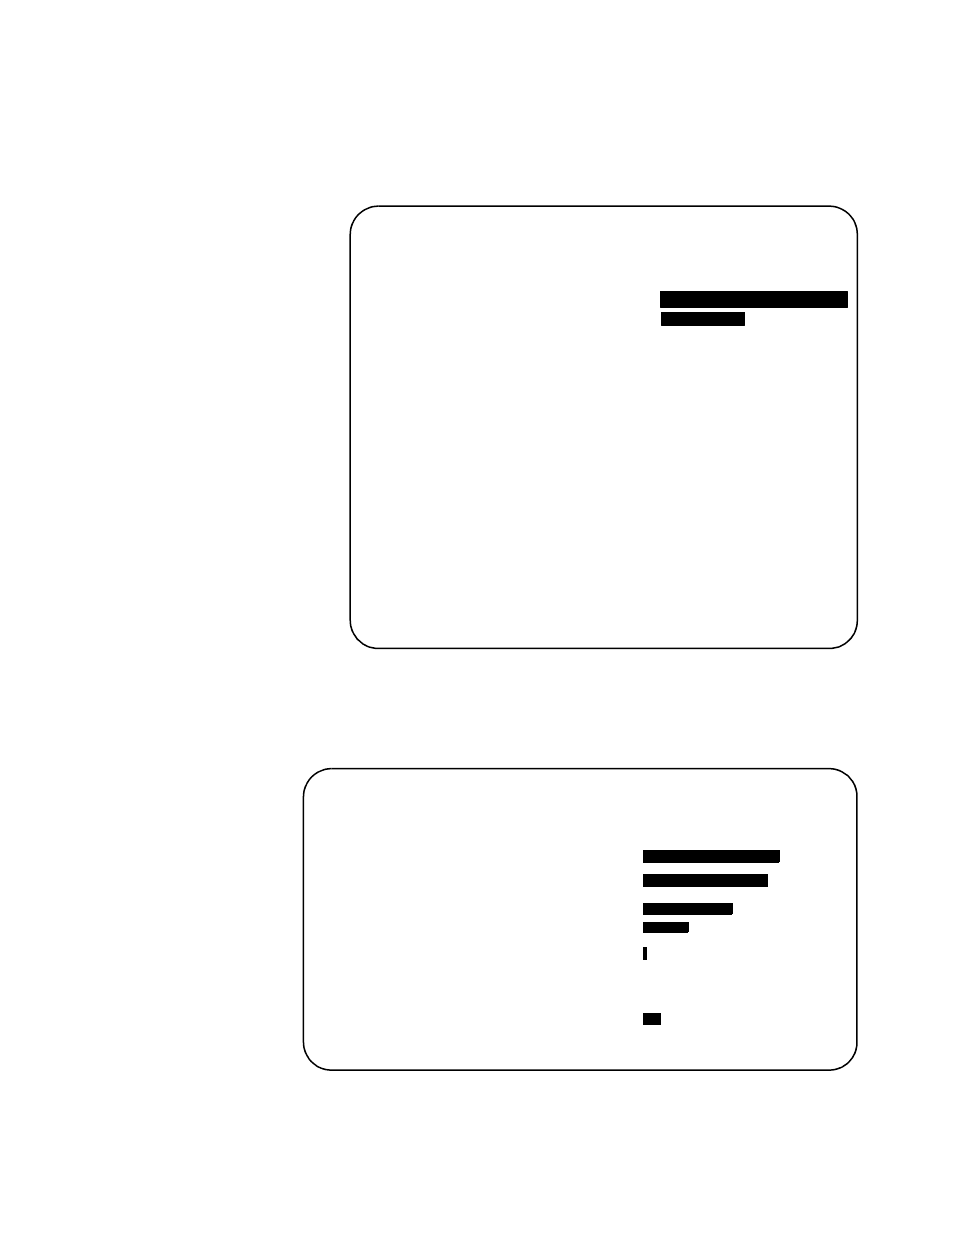
Figure 6-29 Total Received Frames Per Port Graph
3. Select a port number, for example,
Port 1
, to display a screen
similar to Figure 6-30, showing the types of frames received by
Port 1.
Figure 6-30 Received Frames Graph for Port 1
Accounting
Total Received Frames
Port 1 - Room 1147:294791
Port 2 - Room 1148:52018
Port 3:
0
Port 4:
0
Port 5:
0
Port 6:
0
Port 7:
0
Port 8:
0
Port 9:
0
Port 10:
0
Port 11:
0
Port 12:
0
More...
Zero all statistic counters on the entire system
Accounting
Port 1 - Room 1147
Receive Statistics Graph
Received Good Frames:
3791993
Filtered Frames:
2919954
Broadcasts:
949258
Multicasts:
39149
CRC Errors:
2
Alignment Errors:
0
Undersized Frames:
0
Fragments:
444
Long Frames:
0