Menu, Viewing switch statistics, Accounting – Allied Telesis AT-S20 User Manual
Page 102: Receive statistics graph, Figure626 received frames graph, Viewing switch statistics -28, 9lhzlqj#6zlwfk 6wdwlvwlfv

Statistics: Received and Transmitted Ethernet Frames
6-28
6WDWLVWLFV=#5HFHLYHG#DQG#7UDQVPLWWHG#(WKHUQHW#)UDPHV
0HQX1#
Ethernet statistics
You can view statistics on received and transmitted frames in two
ways:
❑
At the switch level, where you see the total of each frame type
on all ports taken together; or
❑
At the port level, further broken down into:
— Per port, all frame types
— Per frame type
Statistics are useful if you are trying to diagnose a problem and
would like to isolate it to a specific port. You can view graphs that
show information on the switch as a whole. From this total picture,
you have the option to view statistics on a per-frame type or a per-
port basis.
9LHZLQJ#6ZLWFK
6WDWLVWLFV
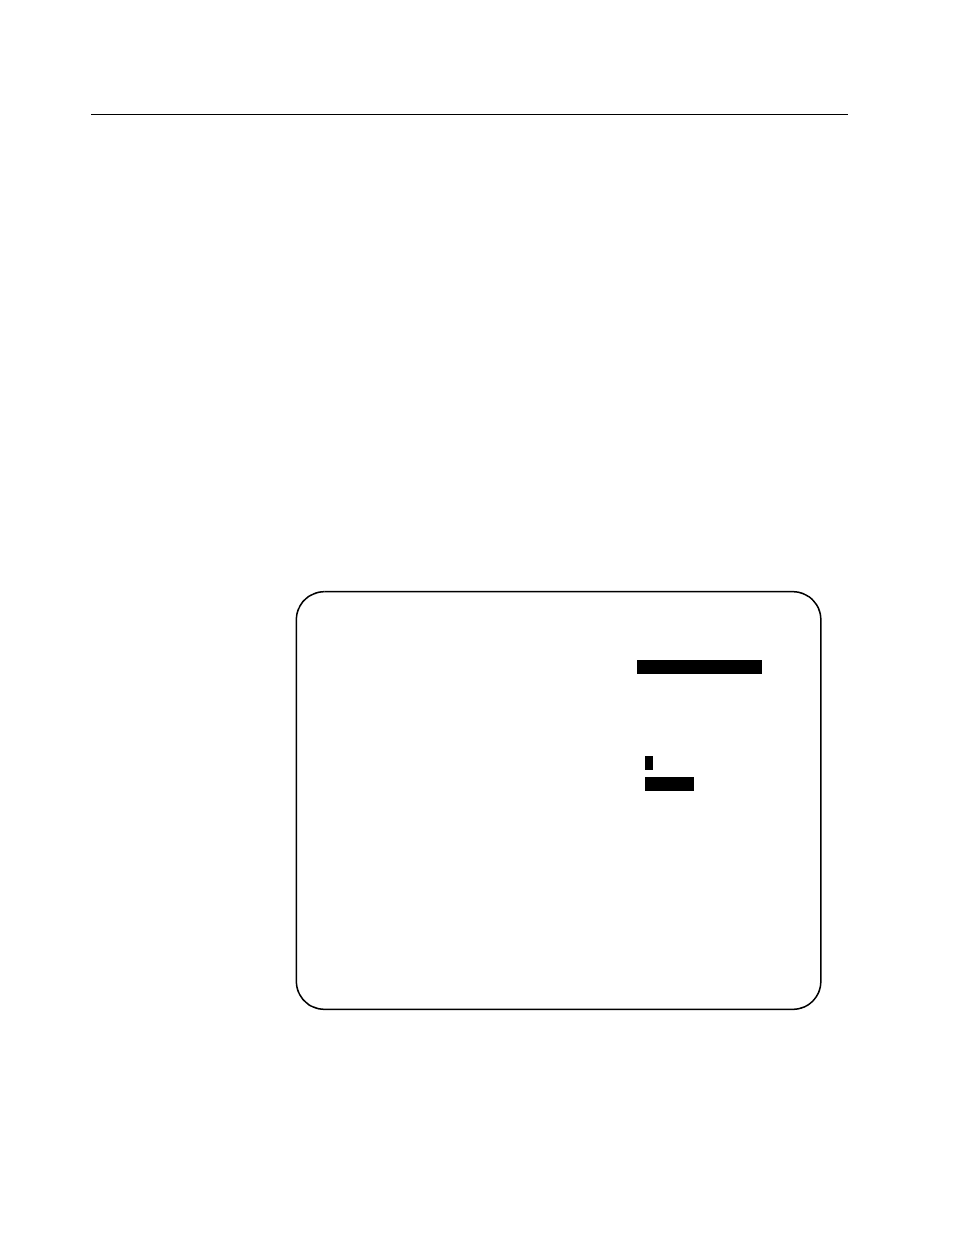
1. Select
Ethernet Statistics
from the Main Menu to display
the Receive Statistics Graph
.
Figure 6-26 Received Frames Graph
Accounting
Receive Statistics Graph
Received Good Frames:
134555999
Filtered Frames:
0
Broadcasts:
0
Multicasts:
0
CRC Errors:
16
Alignment Errors:
39986
Undersized Frames:
0
Fragments
0
Long Frames:
0
Transmit Statistics...
Individual port overview...
RMON Statistics...
Port RMON Statistics...
Zero all statistics counters on the entire system
