Objects that can be displayed in graphs – HP XP P9500 Storage User Manual
Page 25
on X axis, the graph is always displayed on the screen. Therefore, the graph cannot be
displayed by clicking the explanatory note.
12. To close the graph, click Delete Graph.
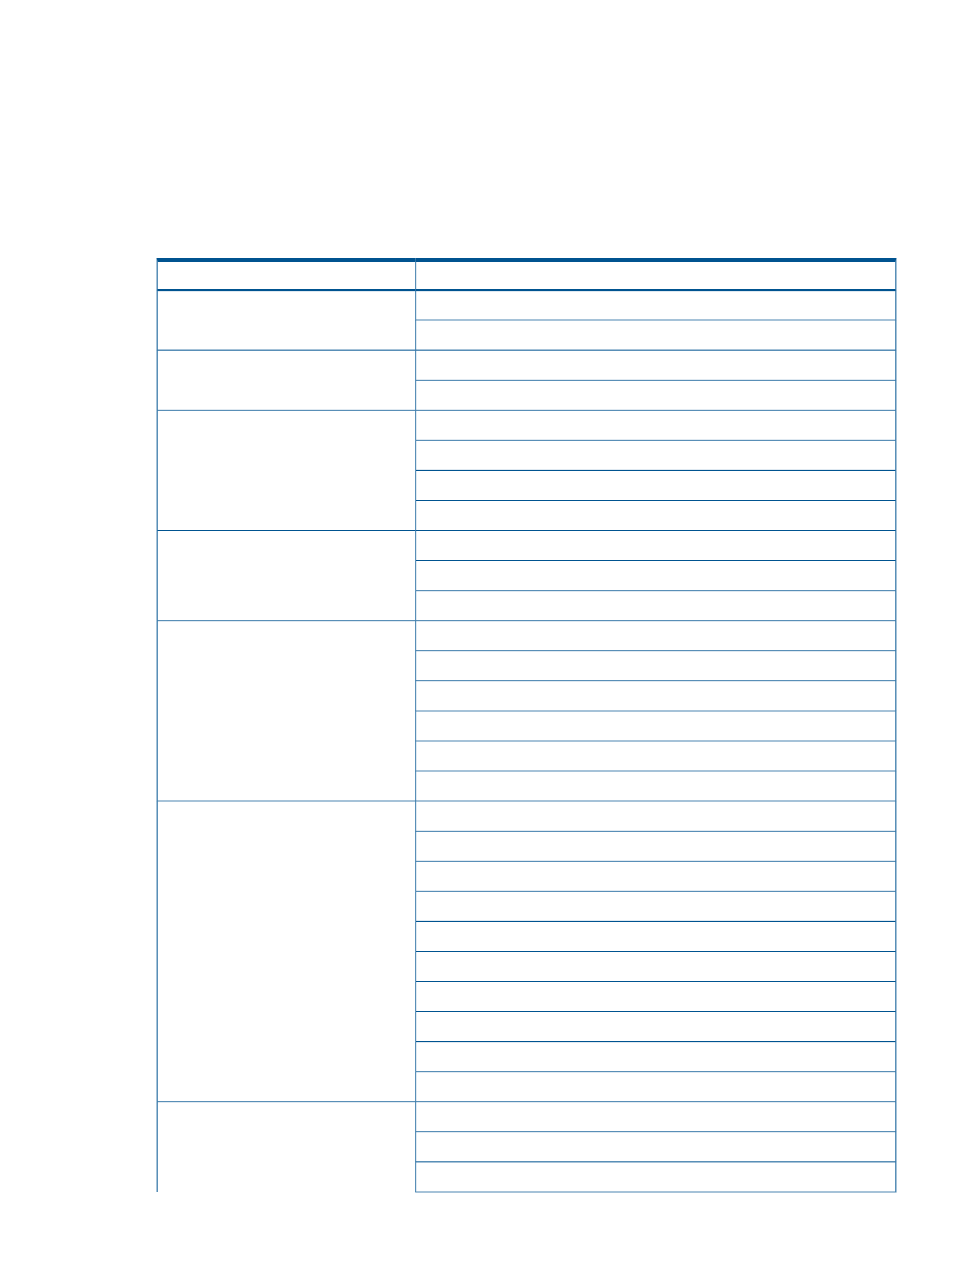
Objects that can be displayed in graphs
Set items to display graph in the Performance Objects: field of the Monitor Performance window.
The outline of target objects and monitoring data that can be displayed in graphs is shown as
follows:
Monitoring data
Monitoring target object
Usage rates of processor blade (%).
Controller
Usage rates of DRR (%).
Usage rates of cache (%).
Cache
Write pending rates (%).
Usage rates of access path between CHA and ESW (%).
Access Path
Usage rates of access path between DKA and ESW (%).
Usage rates of access path between MP Blade and ESW (%).
Usage rates of access path between cache and ESW (%).
Throughput (IOPS).
Port
Data transfer (MB/s).
Response time (ms).
Throughput of WWN (IOPS).
WWN
Data transfer of WWN (MB/s).
Response time of WWN (ms).
Throughput of port (IOPS).
Data transfer of port (MB/s).
Response time of port (ms).
Total throughput (IOPS).
Logical Device
Read throughput (IOPS).
Write throughput (IOPS).
Cache hit (%).
Data transfer (MB/s).
Response time (ms).
Back transfer (count/sec).
Drive usage rate (%).*
Drive access rate (%).*
Usage rates of Business Copy (%).*
Total throughput (IOPS).
Parity Group
Read throughput (IOPS).
Write throughput (IOPS).
Objects that can be displayed in graphs
25