Edit time range window, Graph display area, Time range – HP XP P9500 Storage User Manual
Page 131
Graph display area
Shows graph panels.
Description
Item
Shows the monitor period in the bottom left corner of this window. The
first monitored time and the latest time are shown. If Use Real Time is
selected, the interval is also shown.
The following icon and the message are displayed while changing the
configuration:
Monitoring Term
Graph(s) cannot be updated due to the configuration changing. Wait
for a while.
Opens the Edit Time Range window where you can edit the time range
for monitoring statistics.
Edit Time Range
Adds a new graph.
Add Graph
Closes this window.
Close
Opens the help topic for this window.
Help
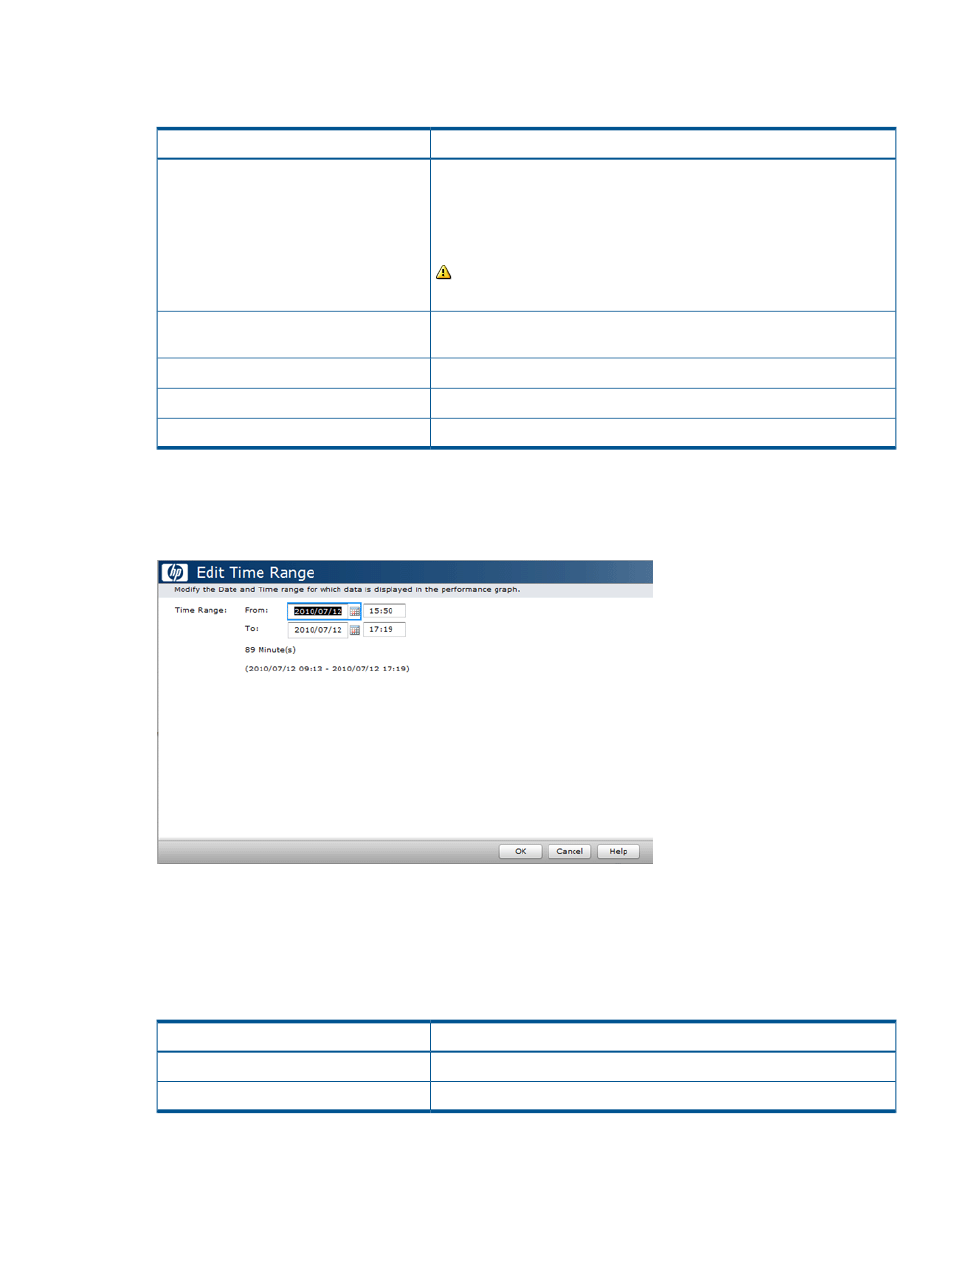
Edit Time Range window
Use this window to select a date and time range for displaying monitoring data in a performance
graph.
Time Range
Specify dates in the From and To fields to define a time range for displaying monitoring data in
a performance graph. You can input directly or select from the calender.
When you specify a time range, Performance Monitor calculates the length of the specified period
and displays the total time in hours and minutes.
Description
Item
Specify the date and time to start monitoring performance.
From
Specify the date and time to stop monitoring performance.
To
OK
Accepts the time range settings and closes this window.
Edit Time Range window
131