HP LeftHand P4000 Virtual SAN Appliance Software User Manual
Page 211
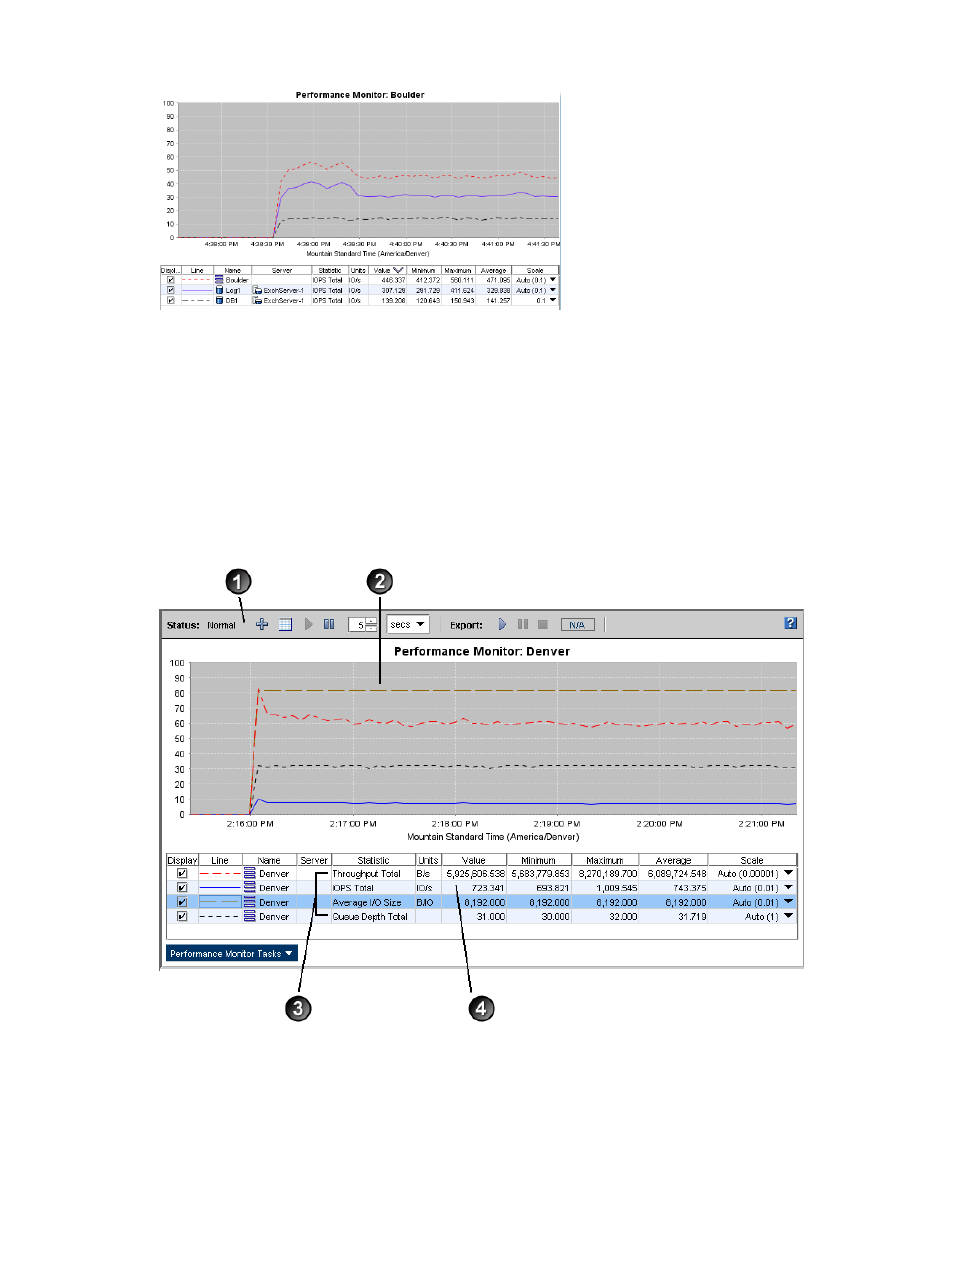
Figure 99 Example comparing two volumes
Accessing and understanding the Performance Monitor window
The Performance Monitor is available as a tree system below each cluster.
To display the Performance Monitor window:
1.
In the navigation window, log in to the management group.
2.
Select the Performance Monitor system for the cluster you want.
The Performance Monitor window opens. By default, it displays the cluster total IOPS, cluster
total throughput, and cluster total queue depth.
Figure 100 Performance Monitor window and its parts
2. Graph
1. Toolbar
4. Statistics table
3. Default statistics
You can set up the Performance Monitor with the statistics you need. The system continues to monitor
those statistics until you pause monitoring or change the statistics.
The system maintains any changes you make to the statistics graph or table only for your current
CMC session. It reverts to the defaults the next time you log in to the CMC.
Accessing and understanding the Performance Monitor window
211