Current san activities example, Workload characterization example, Fault isolation example – HP LeftHand P4000 Virtual SAN Appliance Software User Manual
Page 207
Generally, the Performance Monitor can help you determine:
•
Current SAN activities
•
Workload characterization
•
Fault isolation
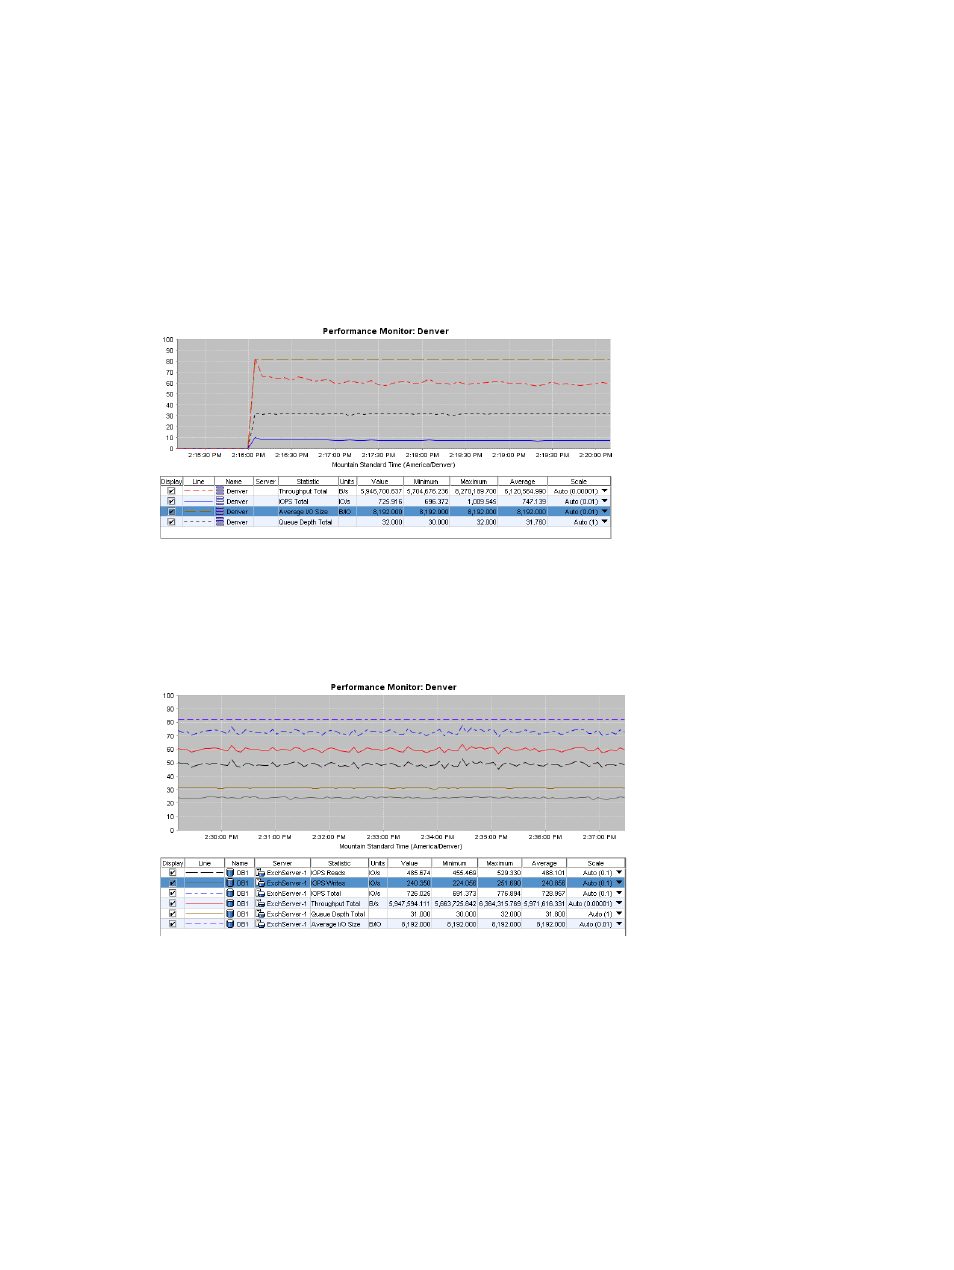
Current SAN activities example
This example shows that the Denver cluster is handling an average of more than 747 IOPS with
an average throughput of more than 6 million bytes per second and an average queue depth of
31.76.
Figure 91 Example showing overview of cluster activity
Workload characterization example
This example lets you analyze the workload generated by a server (ExchServer-1) including IOPS
reads, writes, and total and the average IO size.
Figure 92 Example showing volume’s type of workload
Fault isolation example
This example shows that the Denver-1 storage system (dotted line pegged at the top of the graph)
has a much higher IO read latency than the Denver-3 storage system. Such a large difference may
be due to a RAID rebuild on Denver-1. To improve the latency, you can lower the rebuild rate.
Introduction to using performance information 207