Dh-21 – Xylem DH-21 User Manual
Page 89
DH-21
Using the Graphical “W
ATER
LOG” Software 4-43
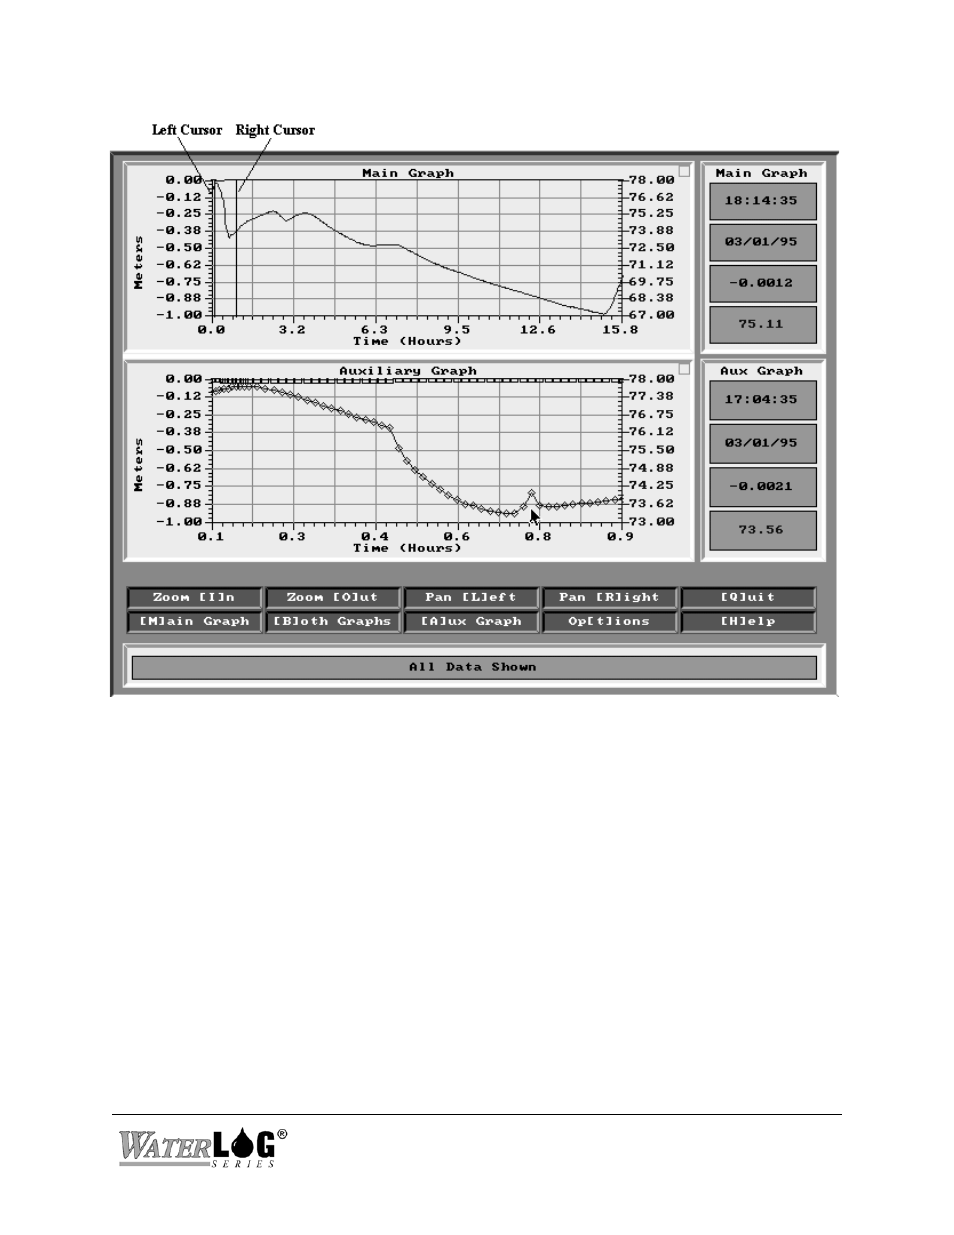
Figure 4-28. View Data Display
When in the “Both Graphs” mode of operation, the main graph will have a set of vertical lines
used for cursors. The data between the cursors will be displayed on the auxiliary graph. The
cursor on the left is the start cursor and the cursor on the right is the stop cursor. The cursors can
be moved by using the Zoom In, Zoom Out, Pan Left, and Pan Right buttons. However, the
cursors can also be moved directly with a mouse. Moving the mouse onto the main graph will
cause the mouse pointer to change from an arrow to a cross hair pattern. While the cross hair
pattern is displayed, the mouse can set the cursors directly. If the mouse is to the left of the start
cursor and the mouse button is pressed, the start cursor will move to the mouse position. If the
mouse is to the right of the stop cursor and the mouse button is pressed, the stop cursor is moved
to the mouse position. If the mouse pointer is between the two cursors, the cursors will alternate
on which one will move. Whenever a cursor is moved, the screen will update showing the cursor
moved to the new position and the data on the auxiliary graph updated. Notice the software will
not allow the start cursor to be placed on the right of the stop cursor.