Dh-21 – Xylem DH-21 User Manual
Page 87
DH-21
Using the Graphical “W
ATER
LOG” Software 4-41
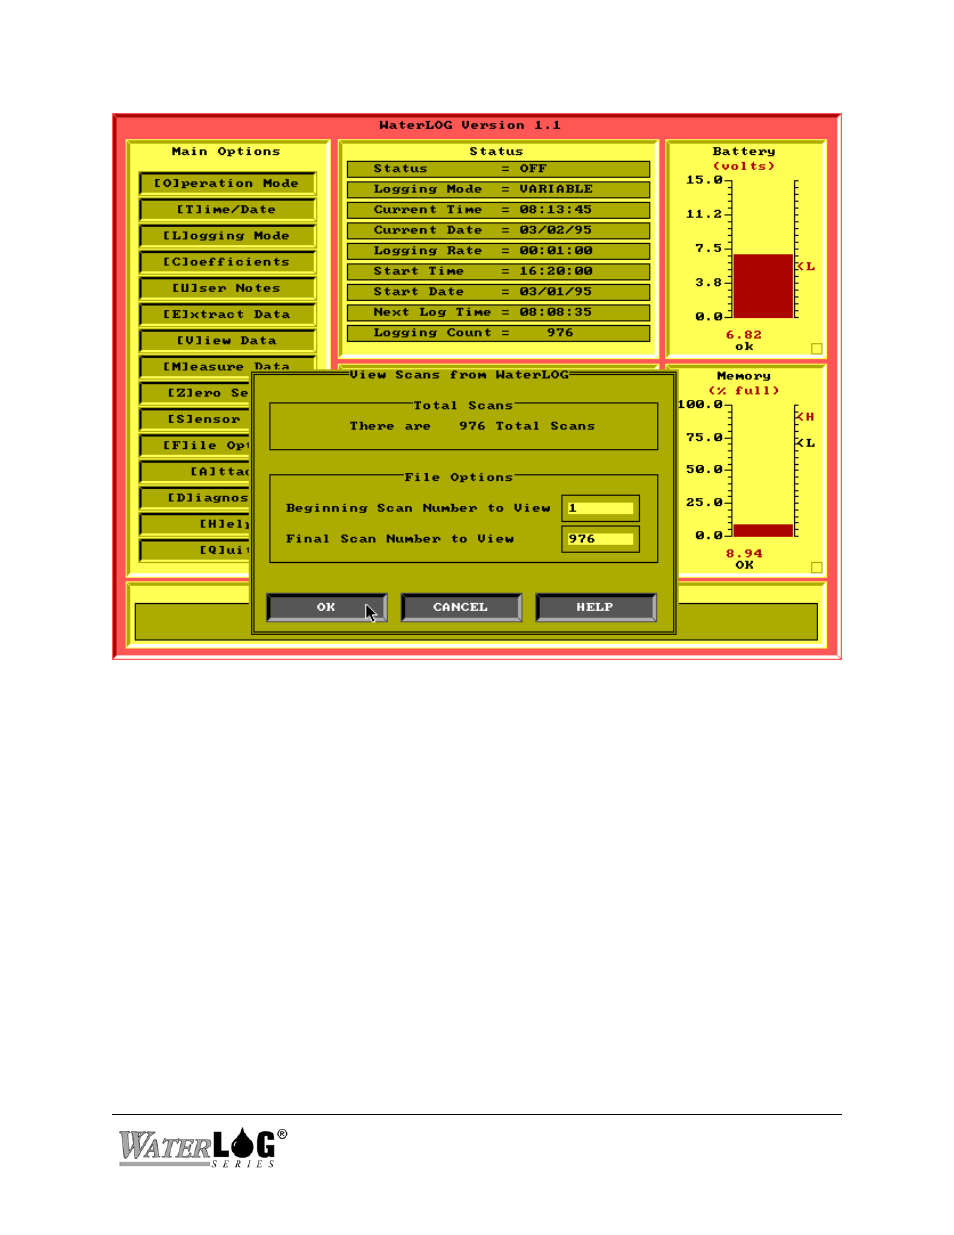
Figure 4-26. View Scans From
W
ATER
LOG Option
When first entering this screen, there will be one graph labeled “Main” (shown in Figure 4-27)
which shows all the data to be graphed. Pressing the button “Both Graphs” (shown in Figure 4-
28) will spilt the screen to show a second graph labeled “Auxiliary”. When both graphs are
displayed, the master graph will also have two cursors (white vertical lines). The auxiliary graph
will show all the data between the cursors. The cursors can be moved using the buttons on the
bottom of the screen allowing the cursors to zoom in, zoom out, pan left, and pan right. While in
the Both Graphs mode, the option button will provide even more features for the auxiliary graph.
- H-2191 (57 pages)
- H-223 (9 pages)
- H-264 (16 pages)
- H-310 (40 pages)
- H-312 (38 pages)
- H-3301 (24 pages)
- H-3342 (30 pages)
- H-335 (32 pages)
- H-339 (21 pages)
- H-340-CalKit (6 pages)
- H-340 (12 pages)
- H-340SDI (32 pages)
- H-3521 (57 pages)
- H-3531 FlashLite (76 pages)
- H-3551 (42 pages)
- H-3553 (36 pages)
- H-375 04101 WIND MONITOR-JR (18 pages)
- H-4161 (36 pages)
- H-4191 (21 pages)
- H-424MS V1.0 (25 pages)
- H-424MS V1.1 (22 pages)
- H-4271 (22 pages)
- H-4280 (34 pages)
- H-4400 (7 pages)
- H-4401 (6 pages)
- H-5223 (107 pages)
- STORM 3 UPGRADE (4 pages)
- System 5000 BASIC Manual (54 pages)
- System 5000 User Manual (136 pages)
- BrazedPlate Heat Exchangers (4 pages)
- Heat Exchangers (8 pages)
- GL500 MULTICHANNEL DATA LOGGER (32 pages)
- 4046 ANALOG TO SDI-12 CONVERTER (7 pages)
- 4015 SDI-12 TO ANALOG CONVERTER (5 pages)
- iRIS-CAM Wastewater Security Camera (11 pages)
- SDI-12 Data Logger iRIS 220, iRIS 320, iRIS 350, iRIS 150, iRIS 300 (111 pages)
- iRIS 150 GPRS DATALOGGERS (53 pages)
- iCE3 GPRS Variant (29 pages)
- GL500-2-1 Data Logger (32 pages)
- 3101 CONDUCTIVITY CONTROLLER (11 pages)
- 3675 pH CONTROLLER (9 pages)
- 378 TEMPERATURE CONTROLLER (9 pages)
- Expert 1400 (16 pages)
- Expert 700 (8 pages)