HP 48gII User Manual
Page 434
Page 12-53
PLOTADD(X^2-X) is similar to
„ô but adding this function to EQ: X^2 -1.
Using
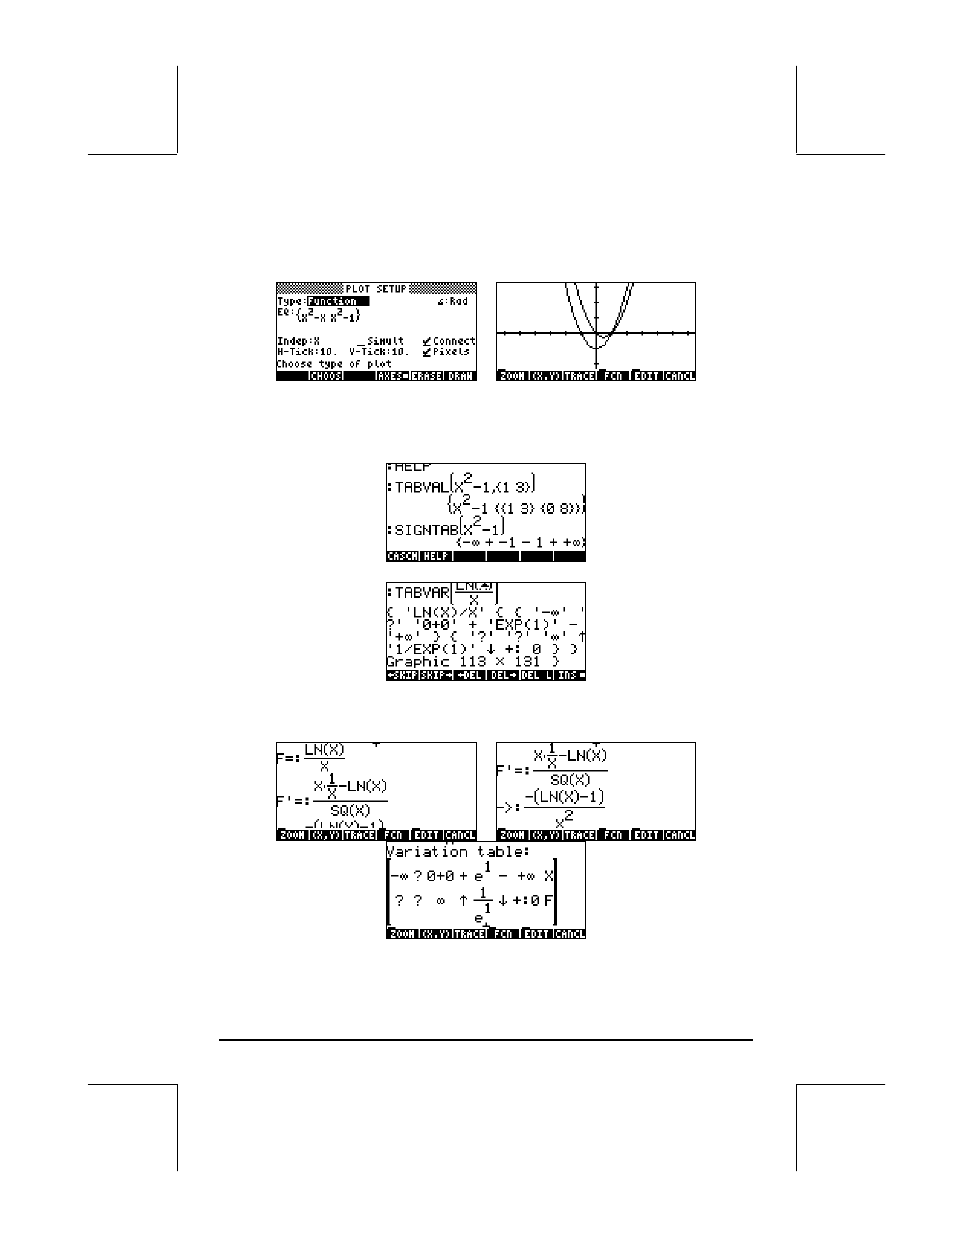
@ERASE @DRAW produces the plot:
TABVAL(X^2-1,{1, 3}) produces a list of {min max} values of the function in the
interval {1,3}, while SIGNTAB(X^2-1) shows the sign of the function in the
interval (-
∞,+), with f(x) > 0 in (-∞,-1), f(x) <0, in (-1,1), and f(x) > 0 in (1,+ ∞).
TABVAR(LN(X)/X) produces the following table of variation:
A detailed interpretation of the table of variation is easier to follow in RPN
mode:
This manual is related to the following products: