W-speed – Wavecom W-SPECTRA (Automatic Monitoring System) V1.1.0 User Manual
Page 16
6
Introduction
WAVECOM Monitoring System W-SPECTRA, W-SPEED Manual V1.1.0
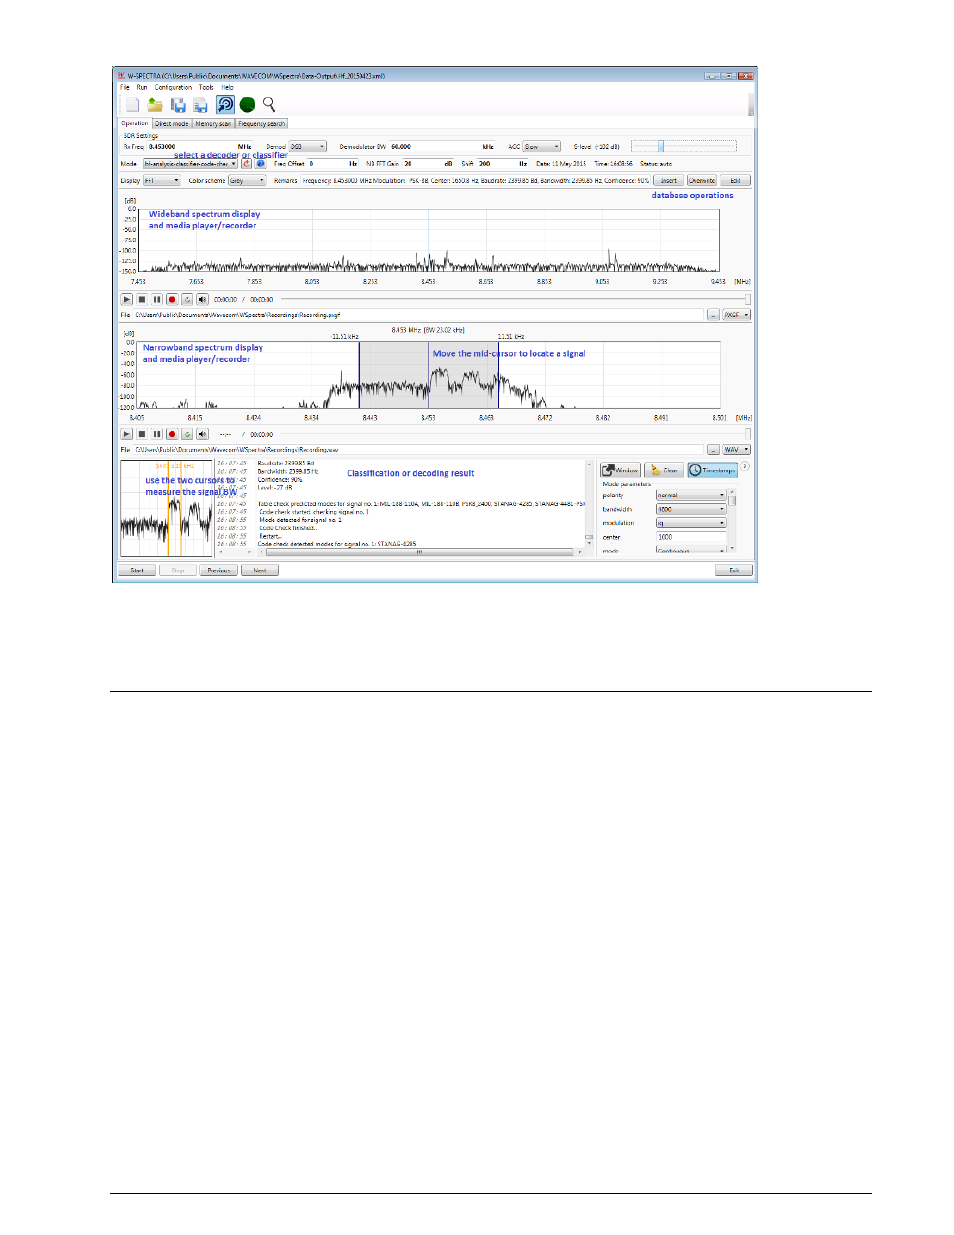
W-SPECTRA GUI Operation tab contains five parts: direct receiver control, classifier and decoder setting,
wideband spectrum display and media player/recorder, narrowband spectrum display and media play-
er/recorder and classification and decoding result display.
W-SPEED
While running online (real-time) spectrum monitoring, a system (e.g., W-SPECTRA) can usually classify
and decode signals in a limited bandwidth in real-time (online). The reasons are usually limited processing
bandwidth of certain components and limited computation power. Signals outside the processing band-
width can not be processed online. To solve this problem W-SPECTRA makes a recording of signals in a
much wider bandwidth than it can process online. The recording is done in a lossless way, usually in base-
band IQ and the recorded signal is processed afterwards by the Spectrum Editing tool W-SPEED.
W-SPEED loads a recorded signal and displays it in a two-dimensional sonagram with the frequency as the
x-axis and time as the y-axis. The sonagram display bandwidth is selectable among 250 kHz, 500 kHz, 1
MHz, 1.5 MHz, 2 MHz, 4 MHz, 8 MHz, 10 MHz, 12 MHz, 16 MHz and 24 MHz, with 2 MHz as default. The
user can examine the sonagram by zooming-in to and navigating over the spectrum, mark an interesting
signal and send this signal to W-SPECTRA or other Wavecom decoders (e.g., W-CODE) for classification
and decoding.
A typical setup of this spectrum investigation is as in the following