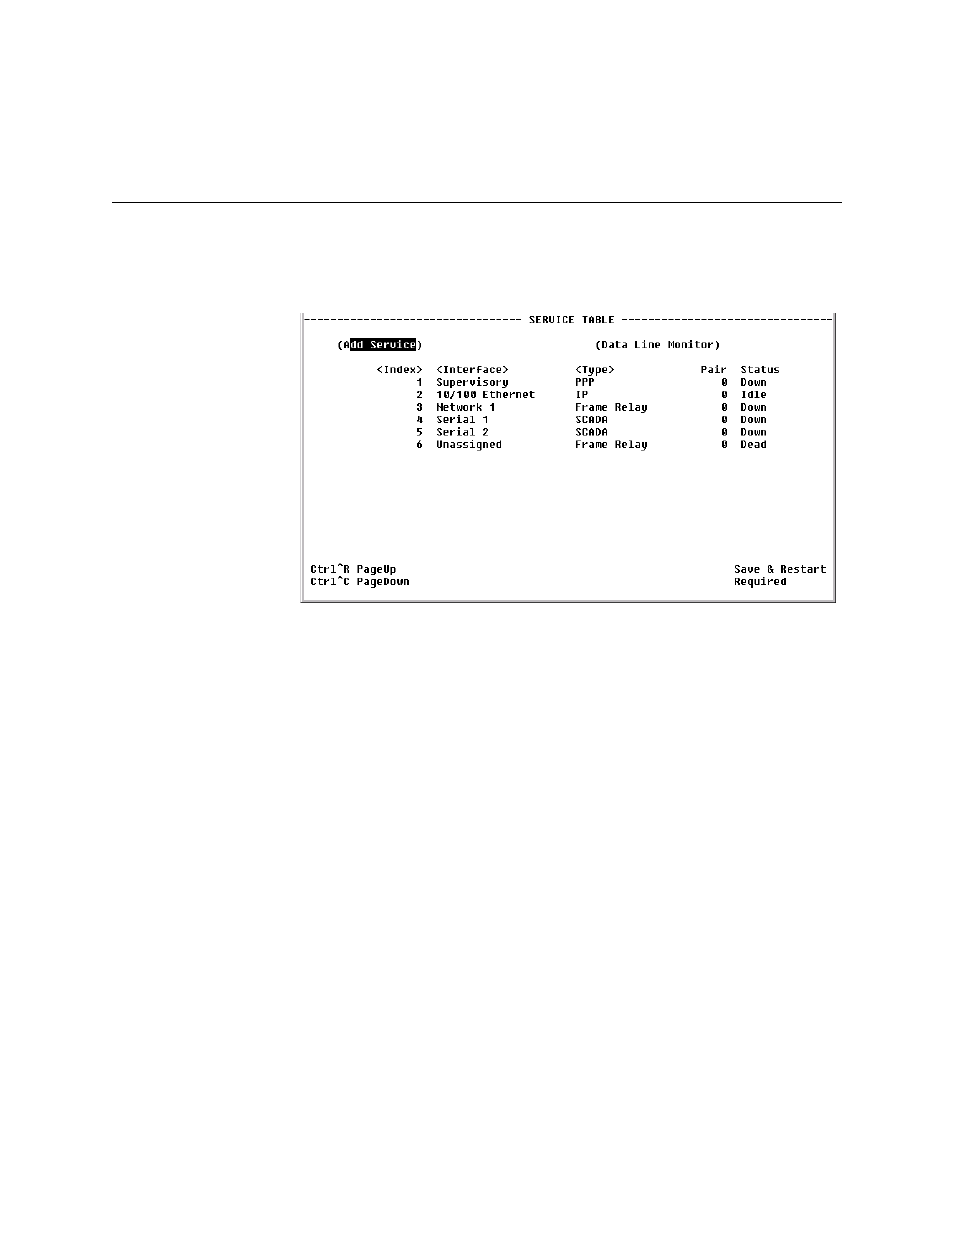
Service table screen, Data line monitor configuration table, Service table screen -20 – Verilink WANsuite 5130 (34-00298.L) Product Manual User Manual
Page 148: Data line monitor configuration table -20

4-20
W A N s u i t e 5 1 6 0 / 5 1 3 0
Current Pin Status
The Current Pin Status, which shows the state of the RS-232 pins, is also
displayed on the Supervisory interface screen.
Service Table Screen
The Service Table screen (Figure 4.16) displays the unit’s defined services
and the displays the Interface, Type, Pair, and Status parameters for each
service.
Figure 4.16
Service Table Screen
The Status for a particular service will display as one of the following:
•
Dead
−
The service is not functional because required resources are not
available.
•
Changed
−
The service parameter was changed and a Save and Restart is
required for the service to function.
•
Down
−
The service is not able to pass data because the physical layer is
down.
•
Physical Up
−
The service is not able to pass data because it has not
completed any required negotiations.
•
Up
−
The service is ready to pass data.
•
Idle
−
The service has nothing to do.
The Service Table screen displays the available services listed by Index
number. To view more detailed information about a service, navigate to one of
the Details screen (such as the Service Details screen described on page 4-23)
by selecting from and entry under the “Index” column (Service Details), the
add a service, select the “Add Service prompt at the top of the screen.
Data Line Monitor Configuration Table
Select the Data Line Monitor prompt at the top of the Service Table screen to
view a screen that displays SCADA port information (Figure 4.17).
