Interpreting the report – Measurement Computing eZ-TOMAS rev.11.0 User Manual
Page 85
Interpreting the Report
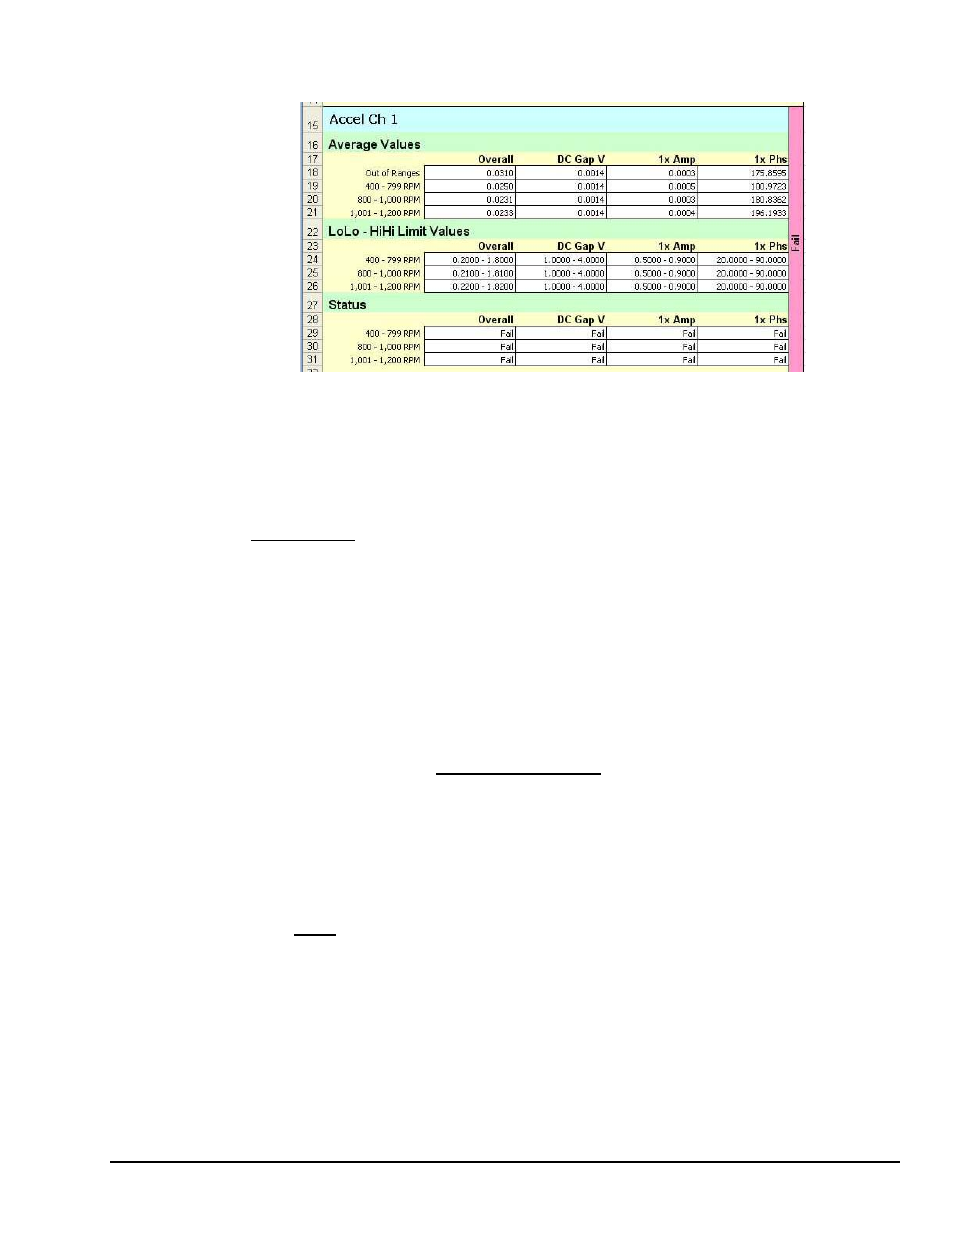
One Channel Block from a Report
In our report example, each channel block has three sections: Average Values, LoLo-HiHi Limit Values,
and Status. Each of these sections includes a grid made up of rows of the RPM ranges that were selected
for the report, and columns of Spectral Bands. If the Default Limits were used to generate the report, only
one row would have appeared in the grid since there are no limit ranges when the Default option is
selected.
The first section of the block (see figure) contains the results of the analysis of the data. In this case it is
the Average Values for all the data. If Out of Ranges was included in the report, this is the only section
where that specific row will appear in the grid. In the example report, each cell in the grid contains the
Average value of all the data for a specific Spectral Band that was gathered for a specific RPM range. For
example, in Channel 1 -labeled Accel Ch 1- the cell under the Overall spectral band column, in the 400 to
799 RPM range row has the value of 0.0250. This means that all of the Overall Band readings, obtained at
an RPM range of from 400 through 799 RPM, have an Average value of 0.0250. The number of readings
that were obtained while the Turbine was running in that speed range is not displayed.
The grid cell under the Overall spectral band column in the Out of Ranges row has a value of 0.0310. This
means that all of the Overall Band readings, obtained at an RPM range that was not within any of the three
RPM ranges shown, has an Average value of 0.0310. The number of readings that were obtained while the
Turbine was not running within any of the three selected RPM ranges is not displayed.
The second section in the report (LoLo-HiHi Limit Values) contains the Limits that were set in the Limits
configuration dialog for each Spectral Band and RPM range. Since Average was selected for the report, an
upper and lower limit is needed for the report. The selected upper and lower limit is shown in the green
shaded area; and the values of these limits are displayed in the grid. As you can see in the report, the
LoLo and HiHi limits were selected, and for the Overall spectral band in the 400 through 799 RPM range,
the lower to upper limits extend from a value of 0.2000 to 1.8000. If a spectral band has zero value for it's
associated RPM range, the Limits cell in the grid displays a "-" character, indicating that the value in the
cell is ignored.
The third (Status) section of the report displays the Pass/Fail results of the Analysis. As stated above, the
Overall spectral band average value for the 400 to 799 RPM range was 0.0250 and the LoLo to HiHi limits
settings for the same spectral band and RPM range were 0.2000 to 1.8000. Since the value of 0.025 is
outside of the range of 0.2 to 1.8, the results of this spectral band/RPM range test resulted in a failure
condition. This is indicated by the word Fail in the Status grid cell [in the Overall spectral band column]
and in the 400 to 799 RPM range row. If a spectral band has zero value for its associated RPM range, the
limit value is ignored for the test and a dash (-) is displayed in the grid. This indicates neither a Pass nor
Fail condition for that value.
If any of the cells in the Status grid contain a Fail state, the right edge of the channel block is set to red, and
displays the word Fail.
eZ-TOMAS
947494
Display Menu …. Reports 8-13