Channels – Measurement Computing eZ-TOMAS rev.11.0 User Manual
Page 57
Channels
The vertical channel bar at the right-hand edge of each plot represents the input channels. The number of
channels that can be displayed is dependent on the plot display format. Some points regarding channels
follow.
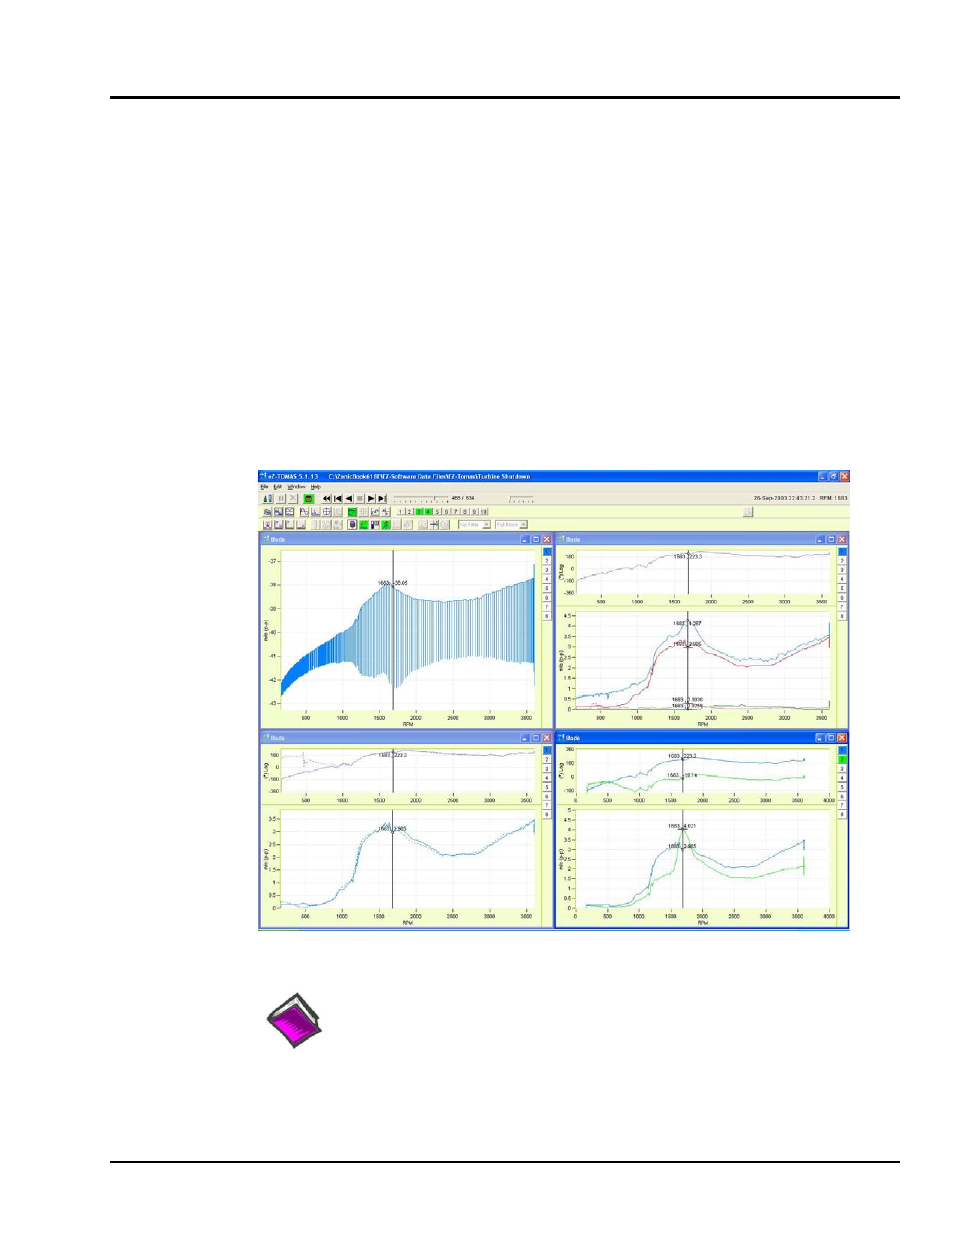
The toolbars apply to the selected plot (the plot which has “focus”). In the figure below the
lower right-hand plot has “focus.” Toolbar buttons are explained in chapter 6.
•
•
•
•
•
•
•
•
A color-filled channel box indicates that the channel is currently being displayed as a trace of
matching color.
A white channel box indicates that the channel is active, but is not being displayed.
A dimmed channel number is not active, thus there is no data to display.
Multiple channels can be plotted on Time, Spectrum, Strip Chart, and Bode displays.
Examples of plot types are provided in chapter 7.
A single channel can be plotted on Waterfall, Polar, and Shaft Center Line displays.
For Orbit displays, the time display of a channel pair and tach pulse location are displayed.
Channel boxes for Tach channels appear in the row below the menu bar.
Four Bode Plots Displayed Simultaneously
Reference Notes:
For toolbar button functions refer to chapter 6.
For examples of various plot display types refer to chapter 7.
eZ-TOMAS
947294
Display Menu … Plots 5-7