Strip chart displays – Measurement Computing eZ-TOMAS rev.11.0 User Manual
Page 70
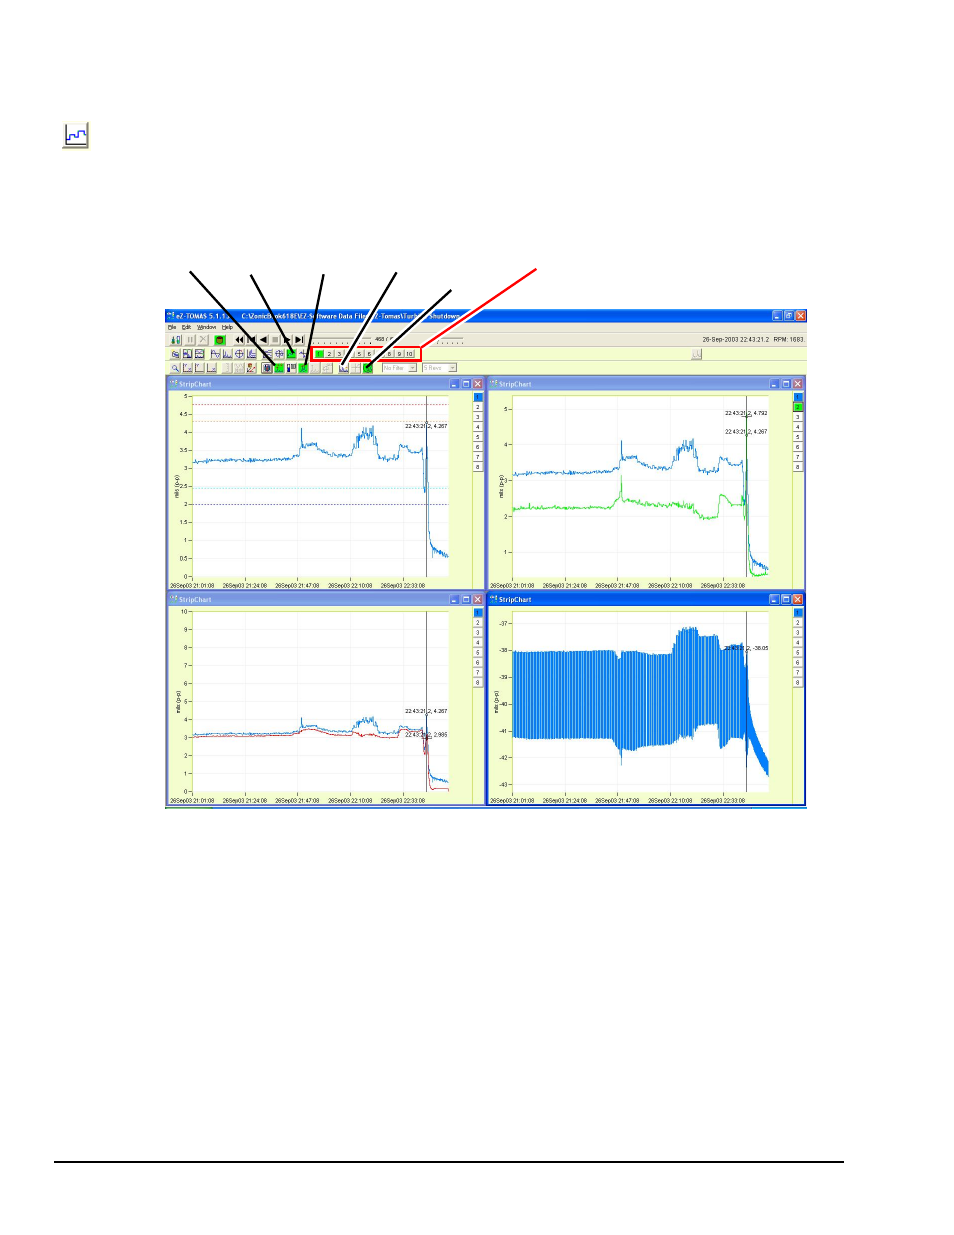
Strip Chart Displays
Strip Chart Displays, show selected instrument gauge values as a function of date and time.
The ten Spectral Band Types are: (1) Overall, (2) DC Gap V, (3)1x Amplitude, (4) 1x Phase,
with these four bands pre-determined; and spectral bands (5) through (10) being user defined.
The spectral bands are selected from numbered buttons located in the central toolbar (see figure).
Display Overlay
Cursor Stripchart Cursor Overlay Bearing Select Spectral Band Type
Display Display Update Limits Clearance (1 through 10)
Circle
7-8 Display Menu … Plots Plot Examples
937594
eZ-TOMAS
Four Strip Chart Displays
In this figure the plot at the lower right has focus.
See also other documents in the category Measurement Computing Hardware:
- ACC-300 (7 pages)
- AI-EXP32 (20 pages)
- AI-EXP48 (19 pages)
- BTH-1208LS (30 pages)
- 6K-ERB08 (32 pages)
- BTH-1208LS Quick Start (4 pages)
- 6K-SSR-RACK08 (33 pages)
- BTH-1208LS-OEM (27 pages)
- CB-COM-Digital (68 pages)
- CB-7018 (68 pages)
- CB-7000 Utilities (44 pages)
- CB-7080D (74 pages)
- CB-COM-7033 (44 pages)
- CB-COM-7017 (72 pages)
- CB-COM-7024 (76 pages)
- CB-NAP-7000P (36 pages)
- CIO-DAC02/16 (16 pages)
- CIO-DAC02 (18 pages)
- CB-NAP-7000D (56 pages)
- CIO-DAC16-I (16 pages)
- CIO-DAC16/16 (20 pages)
- CIO-DAS08 (21 pages)
- CIO-DAC16 (20 pages)
- CIO-DAS08/JR (16 pages)
- CIO-DAS08/JR/16 (14 pages)
- CIO-DAS08/JR-AO (16 pages)
- CIO-DAS08-AOM (32 pages)
- CIO-DAS08-PGM (28 pages)
- CIO-DAS16/330 (34 pages)
- CIO-DAS48-I (17 pages)
- CIO-DAS16/M1 (38 pages)
- CIO-DAS48-PGA (18 pages)
- CIO-DAS800 (20 pages)
- CIO-DAS802/16 (22 pages)
- CIO-DAS6402/16 (40 pages)
- CIO-DAS-TEMP (20 pages)
- CIO-DDA06/16 (18 pages)
- CIO-DDA06/JR (17 pages)
- CIO-DIO24H (20 pages)
- CIO-DIO24/CTR3 (21 pages)
- CIO-DI192 (24 pages)
- CIO-DDA06 (21 pages)
- CIO-DIO48 (19 pages)
- CIO-DO192H (16 pages)
- CIO-DIO192 (20 pages)