Ch 6 - toolbar buttons, Toolbar buttons 6, Toolbar – Measurement Computing eZ-TOMAS rev.11.0 User Manual
Page 59
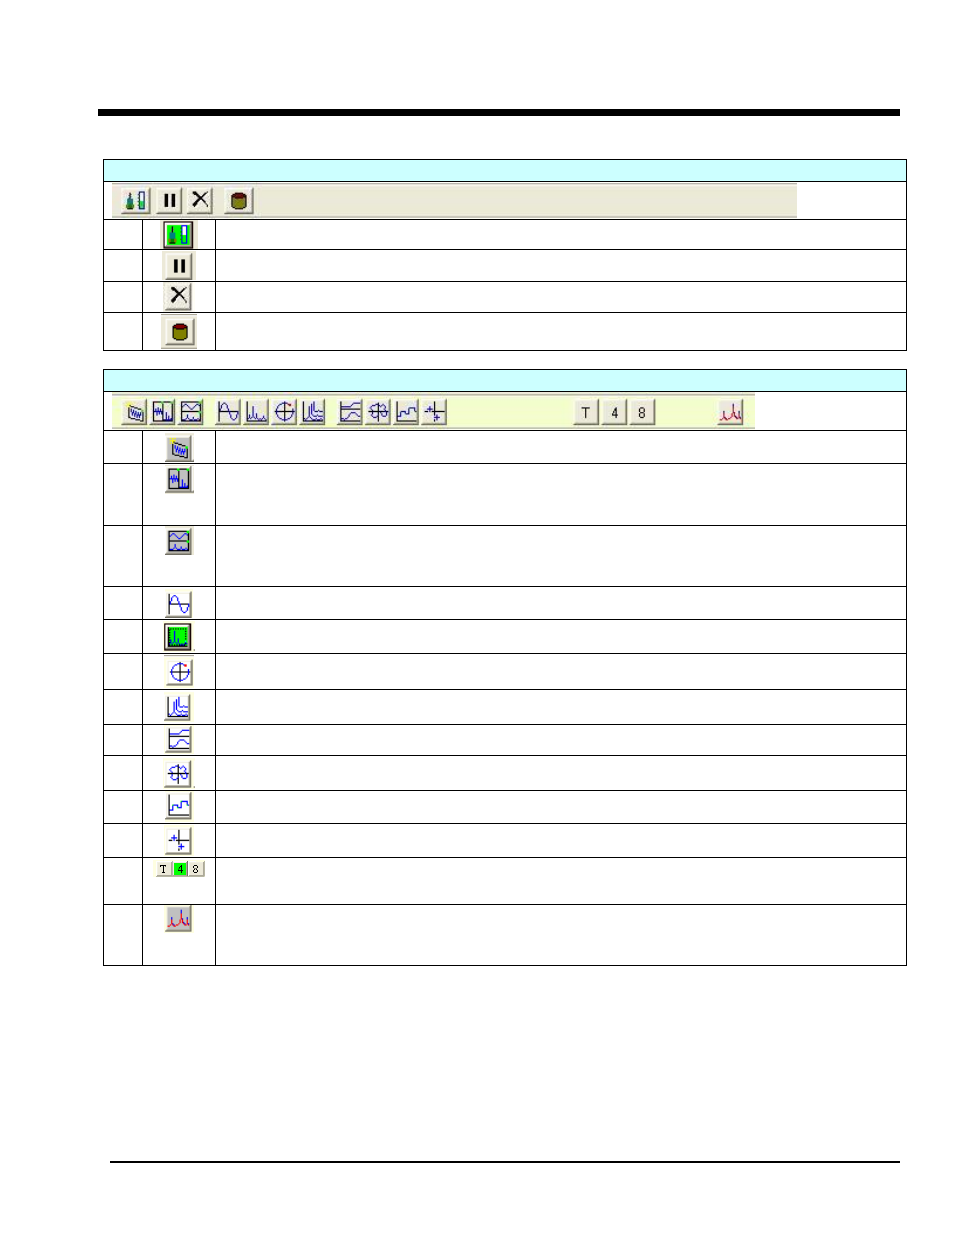
Toolbar Buttons
6
1
st
Toolbar
1
Data Source-Real Time – selects the “Real Time” live data acquisition mode or the “History Data” (Play Back) mode.
2
Pause / Continue – toggles to pause or continue data monitoring. Applies only to the Real Time mode.
3
Clear Real Time Plot Buffer allows you to clear the data in the realtime trend displays. This display option can be used
to clear the plot displays prior to starting a test.
4
Data Source-History File – Opens the History Data Dialog Box to select a file for viewing via the playback (history data)
mode. After clicking this button the playback buttons and related slider will appear.
2
nd
Toolbar
1
Add Plot Window – Adds one more plot window to the screen. Note that there is a limit of 8 plot windows. Versions of
eZ-TOMAS preceding 5.0 have this button located on the right side of the toolbar.
2
Align Plots, Vertical Orientation – Affective with 2 or more plots. This function orients the plot windows such that they
are longer in the vertical direction. With 8 plot windows, eZ-TOMAS will display 2 rows of 4 plot windows. Compare this
feature to the following “Align Plots, Horizontal Orientation.” Versions of eZ-TOMAS preceding 5.0 have this button
located on the right side of the toolbar.
3
Align Plots, Horizontal Orientation – Affective with 2 or more plots. This function orients the plot windows such that
they are longer in the horizontal direction. With 8 plot windows, eZ-TOMAS will display 4 rows of 2 plot windows.
Compare this preceding “Align Plots, Vertical Orientation.” Versions of eZ-TOMAS preceding 5.0 have this button located
on the right side of the toolbar.
4
Time Waveform - Selects Plot Display window for which the x-axis is in units of time.
5
Spectrum – Selects a Plot Display window for which the x-axis is in frequency-related units.
6
Orbit – Used to plot a time waveform for a channel pair. The data will is displayed in a polar format.
7
Waterfall – Selects a Plot Display window that makes use of x, y, and z axis. Waterfall plots display data as a series of
Spectral Maps. Some users refer to Waterfall Plots as Cascades.
8
Bode – Selects a plot display window in which the x-axis is scaled in RPM.
9
Polar – Selects a window for a circular plot with units of g’s/division.
10
Stripchart – Selects a stripchart type plot display window.
11
Shaft Centerline – Used to plot a shaft centerline orbit as a trend in Gap Voltage for a channel pair. The data is
displayed in a polar format.
12
Tachometer Reference – Choosing a channel number sets the tachometer reference channel to be displayed, regardless
of the Setup Configuration settings. If only one channel is displayed the “T” option is available. “T” assigns the reference
tachometer in accordance with Setup Configuration.
13
Show Baseline – superimposes a pre-recorded baseline on top of display data. This option is only available in the Time
or Spectrum plots. Show Baseline is typically used to compare a spectrum with another (the baseline) which was taken
when the machine was known to be in good working condition. Show baseline is only available for multiple plot
applications.
eZ-TOMAS
937694
Toolbar Buttons 6-1