Toolbar – Measurement Computing eZ-TOMAS rev.11.0 User Manual
Page 60
3
rd
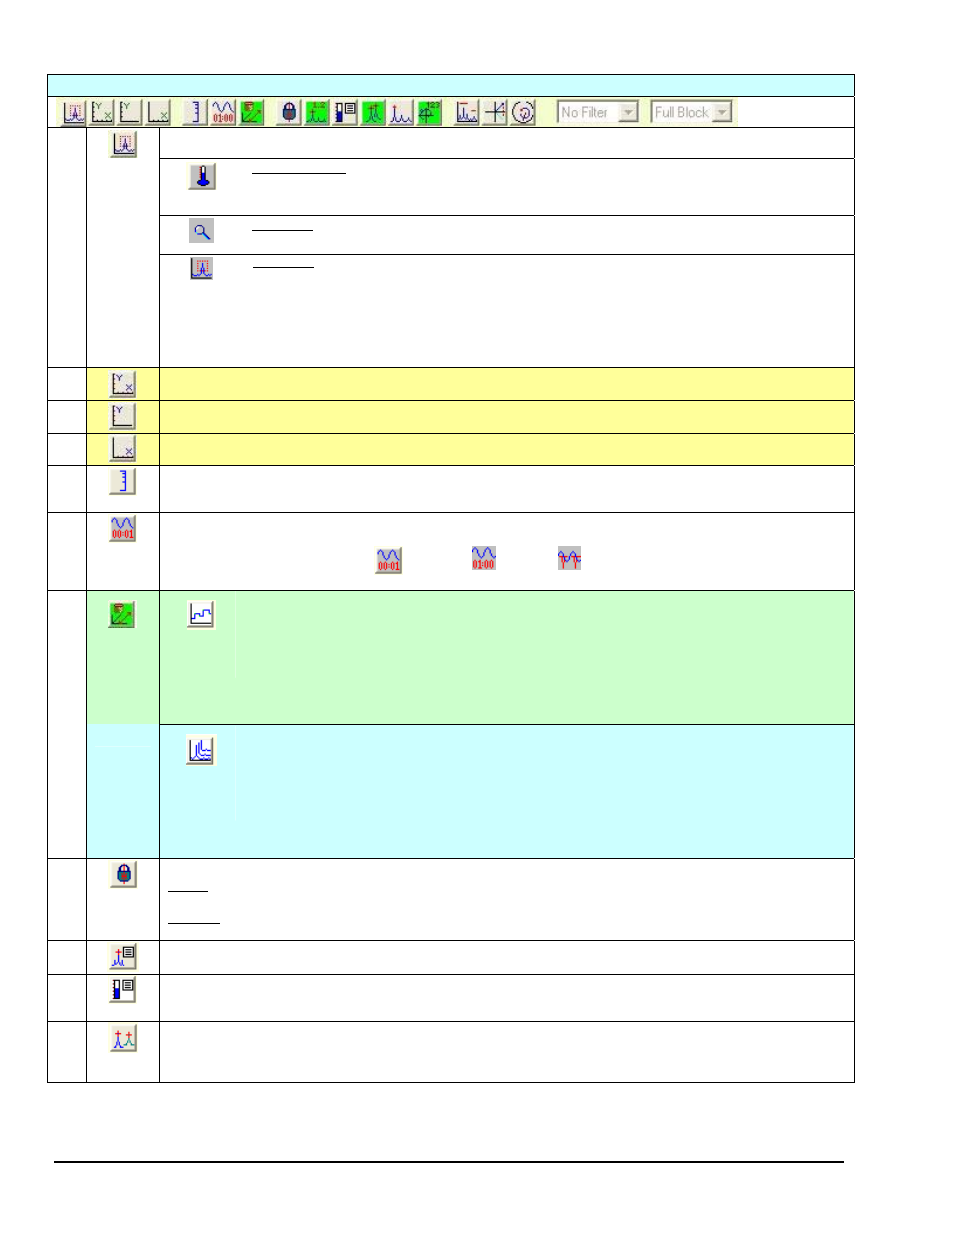
Toolbar
Scale – Toggles between Instrument Scale, Auto Scale, and User Scale. User Scale is shown in the figure.
Instrument
Scale
Instrument Scale is the default. It displays the data based on the instrument’s Engineering Units range.
Auto Scale
Auto Scale automatically scales the axes based on the data being displayed.
1
User Scale
User Scale is used to display data in relation to a user-defined scale. You can quickly customize a scale as
follows:
(1) press the
(2) press the
(3) move the mouse cursor to draw a rectangle around the area of the plot that you desire to view.
(4) release the mouse button and the two keys. Your plot should now have a new and more practical
scale.
2
Manually Scale X and Y Axis – A diagonally oriented dual-arrow cursor appears. The cursor lets the user simultaneously
adjust both the X-axis and Y-axis by dragging the mouse.
3
Manually Scale Y Axis – A vertical dual-arrow cursor appears. The cursor lets the user manually adjust the Y-axis by
dragging the mouse.
4
Manually Scale X Axis – A horizontal dual-arrow cursor appears. The cursor lets the user manually adjust the X-axis by
dragging the mouse.
5
Linear / Log Scale Y Axis – Spectrum Display Only. This button allows you to switch between Linear and Log Y-axis
scaling. If you expand the data plot this feature is disabled until the plot is returned to its original scale via the Auto Scale
button.
6
Frequency Axis – Used to set the x-axis to Hz, kCPM, or Orders. Applies to Spectrum Plot Windows only. Each click of
the Frequency Axis button toggles the x-axis unit of measure, i.e., Hz, kCPM, Orders, Hz, kCPM, Orders, etc.
Hz
Kcpm
Orders
7
With
Stripcharts
selected
Delta Time or Delta Record – For Stripcharts Only: Selects one of two X-axis spacing types.
(a) When button (7) is gray, Delta Time is selected for the X-Axis. Delta Time spacing displays data with
absolute time for the X-axis.
(b) When button (7) is green, Delta Record is selected for the X-Axis. Delta Record has X-axis time
spacing based on record changes. Thus the time line on the X-axis is not uniform. Delta Record spacing is
good when there are short acquisition durations over long periods of time as vacant time slots are
eliminated from the display.
With
Waterfall
selected
Skip Records or Use All Records – For Waterfalls Only: Selects one of two display modes.
(a) When button (7) is gray, “use all Records” is selected and the entire Waterfall will scroll. Scrolling can
be forward or backward.
(b) When button (7) is green a maximum of 100 records will be scrolled based on a Skip Record Factor.
SRF = History Records / Waterfall Records - 1. Thus if we had 634 history records and 100 waterfall
records we would have a skip factor of 6.4 records, i.e., 634 / 100-1 = 6.4 records. This skip factor would
result in 100 records being scrolled. Note that the SRF is automatically calculated and applied by software.
8
Multiple Trace Cursor
Locked - When locked, a single cursor will maintain a reference mark for each trace in the plot window, i.e, at each point
where the cursor intersects a waveform.
Unlocked - When unlocked, there will only be one reference mark on the cursor. The mark will only apply to the first trace
(lowest number channel). However, a separate cursor can be used for each trace.
9
Display Cursor Values – allows you to show a plot cursor with annotation. A cursor is provided with each plot trace.
Cursors can be visible or hidden.
10
Display Gauge Values – opens a floating table of gauge values. Alternatively, it allows cursor values to be displayed, if
the Display Cursor Values button is activated. (see Display Cursor Values). Note that the “L” key on the keyboard can be
used to display the gauge values.
11
Cursor Update - Fixed X axis / Peak Search – When this button has a gray background, the x-axis is fixed and the
cursor will not move when a new spectrum is plotted. When the button has a green background “Peak Search” is in effect
and the cursor will automatically move to the highest point on the plot. The button is typically used for Spectrum plots,
either Real Time or Historical Data.
6-2 Toolbar Buttons
937694
eZ-TOMAS