Measurement Computing eZ-TOMAS rev.11.0 User Manual
Page 52
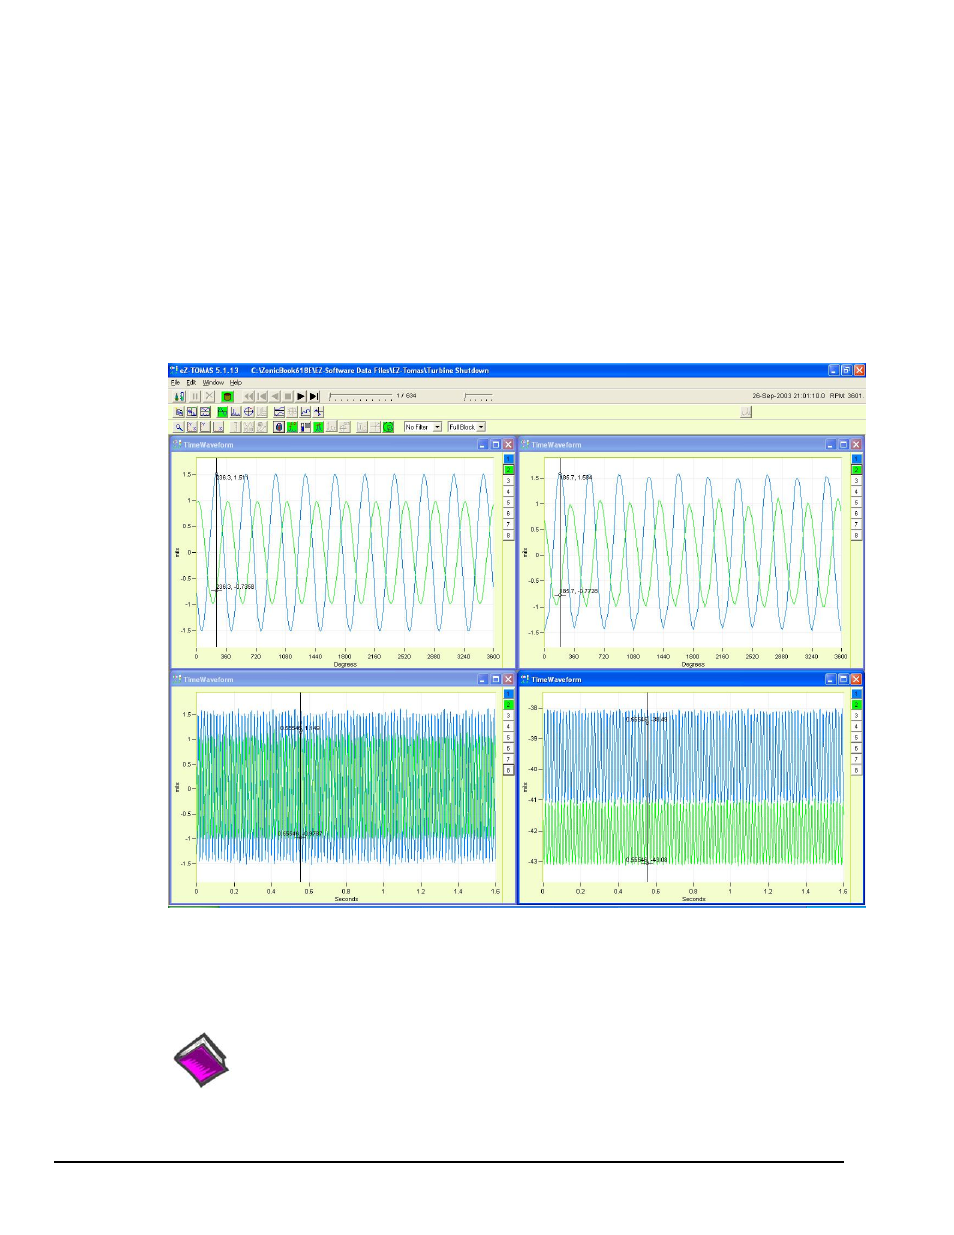
In the Window below the following is true:
o
four Time Waveform plots are present
o
the plot at the lower right has “focus,” thus the toolbars currently apply to that plot
o
channels 1 and 2 have been selected for display in each of the plots
o
from the first (top) toolbar button we can see that historical data is being used (the
button is active)
o
from the second toolbar we can see that the Time Waveform display format is selected
o
from the third toolbar we know that:
- Auto Scale (magnifying glass) has been selected , instead of Instrument Scale or User Scale)
- Cursor Display (9
th
button) is selected. This shows a plot cursor with annotation.
- Cursor Update for Peak Search (11
th
button) is active
- Overlay Bearing Clearance Circle (16
th
button) is active
History Data – Time Waveforms
Plot controls can be data that is in “Real Time” or pre-recorded, i.e., “History Data.” A different set of
control buttons will be present depending on which mode you are using. In addition, Time Display and
Spectrum Display formats differ in regard to certain control options.
Reference Notes:
For toolbar button functions refer to chapter 6.
For examples of various plot display types refer to chapter 7.
5-2 Display Menu … Plots
947294
eZ-TOMAS