Real time” plot controls – Measurement Computing eZ-TOMAS rev.11.0 User Manual
Page 21
3. Select the Channel(s) and Display type for each window.
Time Display and Spectrum Display Plots Tiled Horizontally
Each plot is longer in the horizontal direction.
A cursor is provided with each display. To move the cursor, place your mouse icon over the cursor and
drag it to the desired location on the trace or use the East / West Arrows.
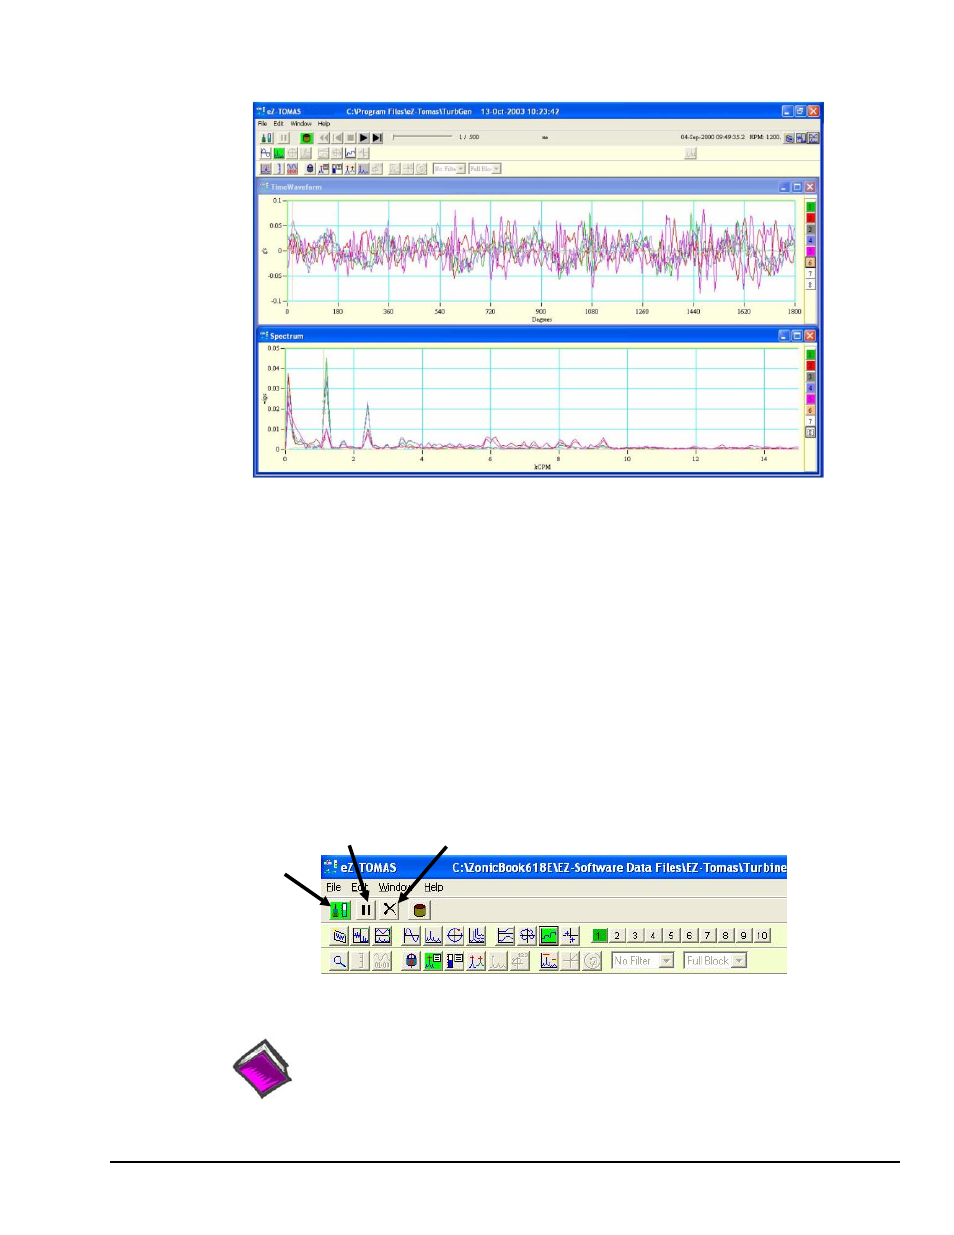
“Real Time” Plot Controls
“Real Time” is the default data source. For Real Time displays you can Halt and Resume the display of
data by using the <Pause/Continue> toggle button (see following figure). As an option to the
buttons follows shortly.
The
the realtime trend displays. This display option can be used to clear the plot displays prior to starting a
test.
Pause/
Continue
Clear Real Time
Plot Buffer
Selects
Real Time
Mode
Real Time Mode is Selected
Reference Note:
Refer to chapter 6 for more detailed information regarding Plots and the associated toolbar
buttons and other controls.
eZ-TOMAS
987294
Monitoring a Machine 2-7