Viewing reports – Measurement Computing eZ-TOMAS rev.11.0 User Manual
Page 23
Viewing Reports
eZ-TOMAS can generate the following types of reports, which are accessible from the Display pull-down
menu.
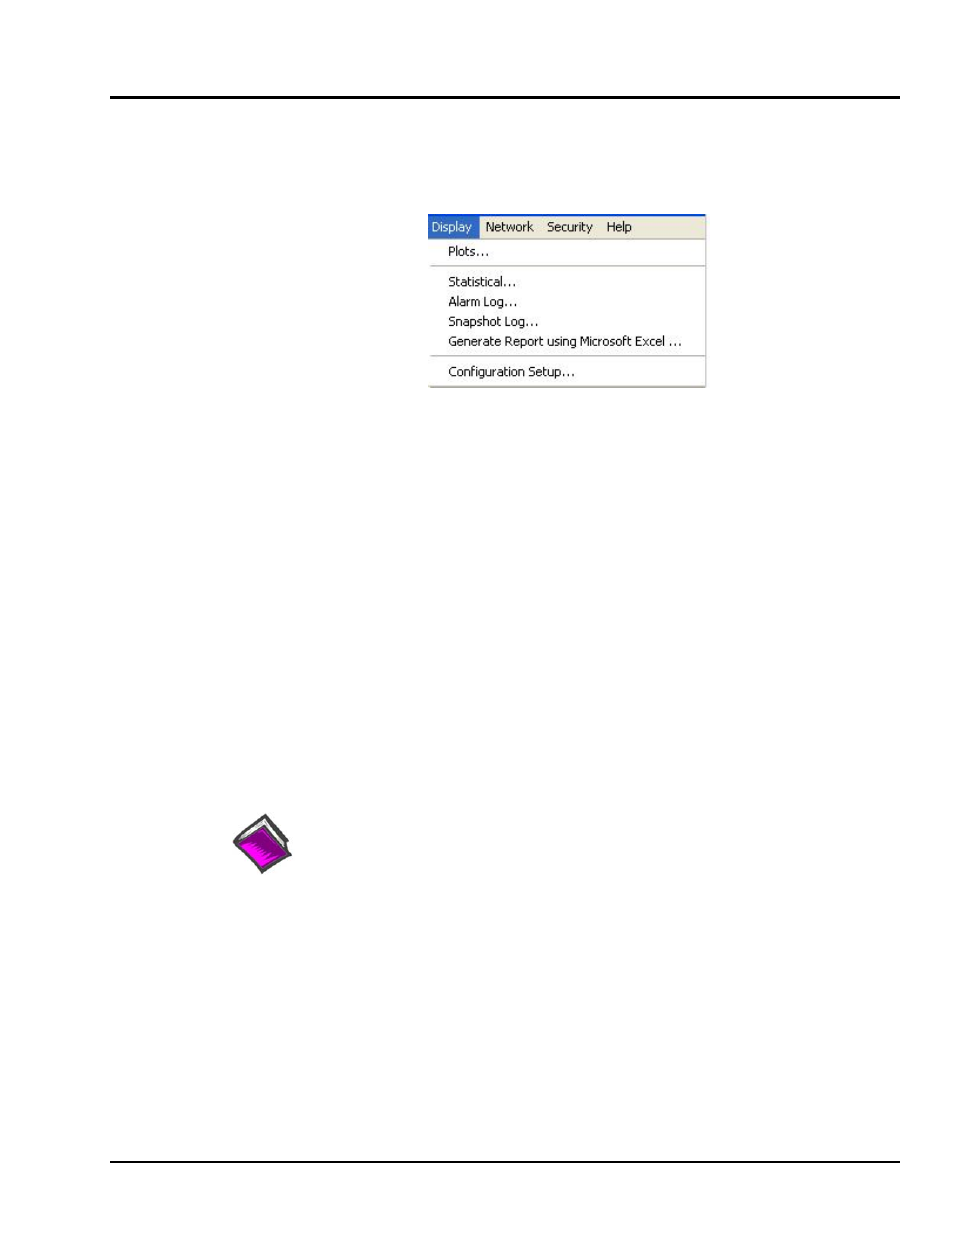
Display Pull-down Menu
The Statistical Report lists the historical spectral band data. It includes the instrument, the engineering
units, the minimum value, the mean average value, the maximum value, and the standard deviation by
channel. Statistical reports can be used to automatically generate limit values based on historical data.
The Alarm Log is a record of the last “N” number of alarm events. The number of alarms was specified in
the Setup Configuration window under the Storage Tab. The Alarm Log includes the date and time, the
channel number, reference tachometer, instrument name, spectral band type, alarm type, and value of the
alarm signal.
The Snapshot Log can be accessed from the Reports pull-down menu, or from the History Data Window.
The Snapshot Log file contains entries which were created whenever the user clicked the
button, which is located in the Gauge Window’s Data Storage panel.
The Generate Report using Microsoft Excel option is available beginning with eZ-TOMAS version
5.0.x. The feature allows you to generate a report using Microsoft Excel 2000 (version 9.x) or later.
An XL Report generation dialog box allows you to format the report and specify its contents.
Selecting Configuration Setup from the Reports pull-down menu creates a text file that contains
configuration details of the current project.
Reference Note:
Refer to Chapter 6, Display… Reports, for detailed information regarding each report type and
for instructions pertaining to generating limits.
eZ-TOMAS
987294
Monitoring a Machine 2-9