Changing the height of graph – Compix Persona User Manual
Page 123
Chapter 6 Page Mode
Document No: 2.3.004 Revision: 2.0 Updated: 3/21/2012
Changing the Height
of Graph
When the scale value is adjusted within the graph, the changes as shown below will take
place.
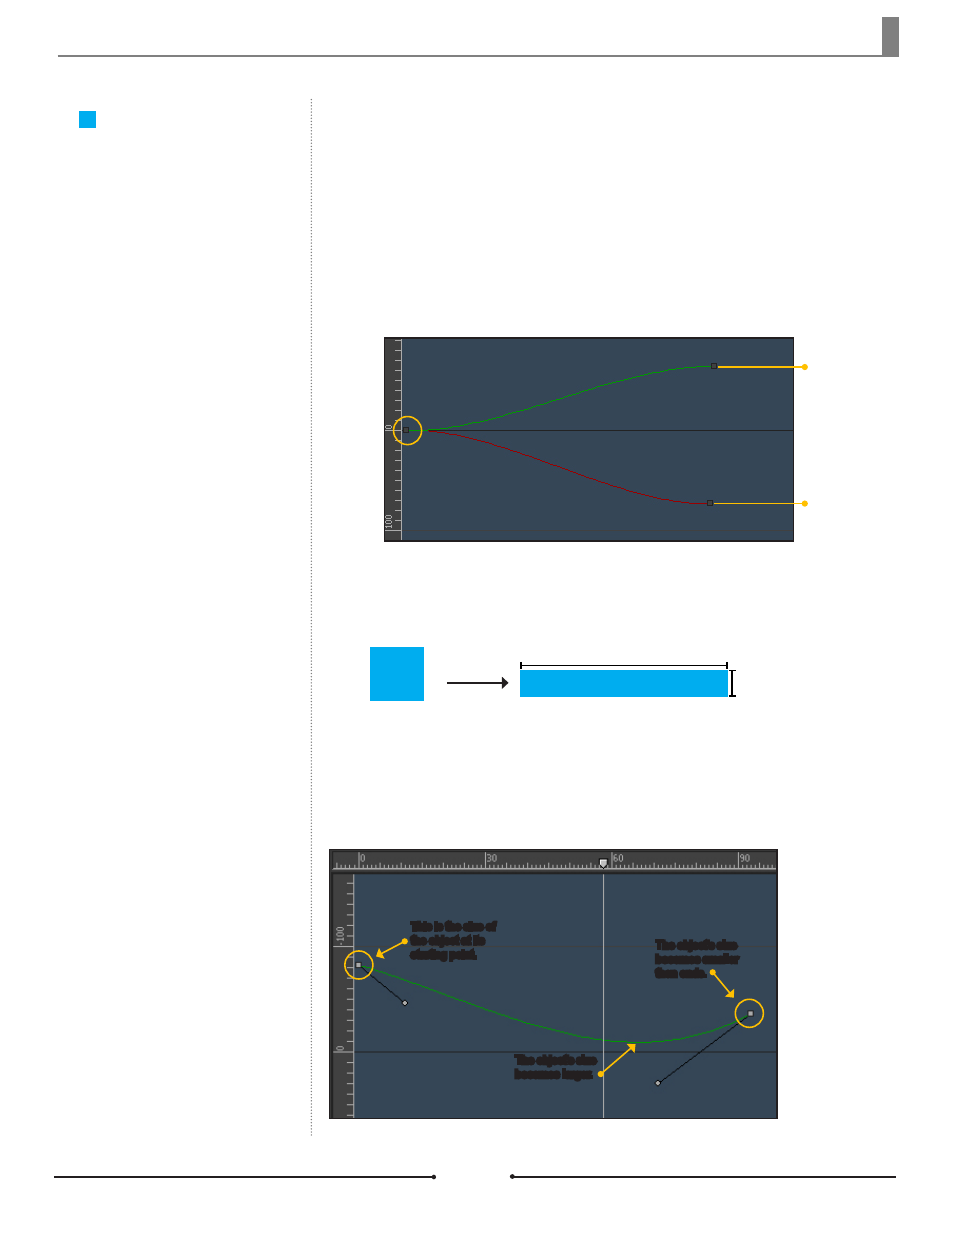
The line graph below shows the scale of the Y value of an object becoming larger then
smaller by first declining then inclining.
Changing the height of the line graph indicates that an object is in motion along that axis.
The graph below shows the line graphs representing the X and Y axes. The X line graph
is at a decline, meaning the X values are increasing, while the Y line graph is at an incline,
meaning the Y values are decreasing.
Both lines converge at the Starting Point as this is the initial point of the animation.
Y = Decrease
X = Increase
Starting
Point
Object at Starting Point
Increase Scale of X Value
Decrease Scale of Y Value
This is the size of
the object at its
starting point.
The object's size
becomes smaller
then ends.
The object's size
becomes larger.
Compix Persona
123