Graph of timeline, Function curve, Graph reading method – Compix Persona User Manual
Page 121
Chapter 6 Page Mode
Document No: 2.3.004 Revision: 2.0 Updated: 3/21/2012
Graph of Timeline
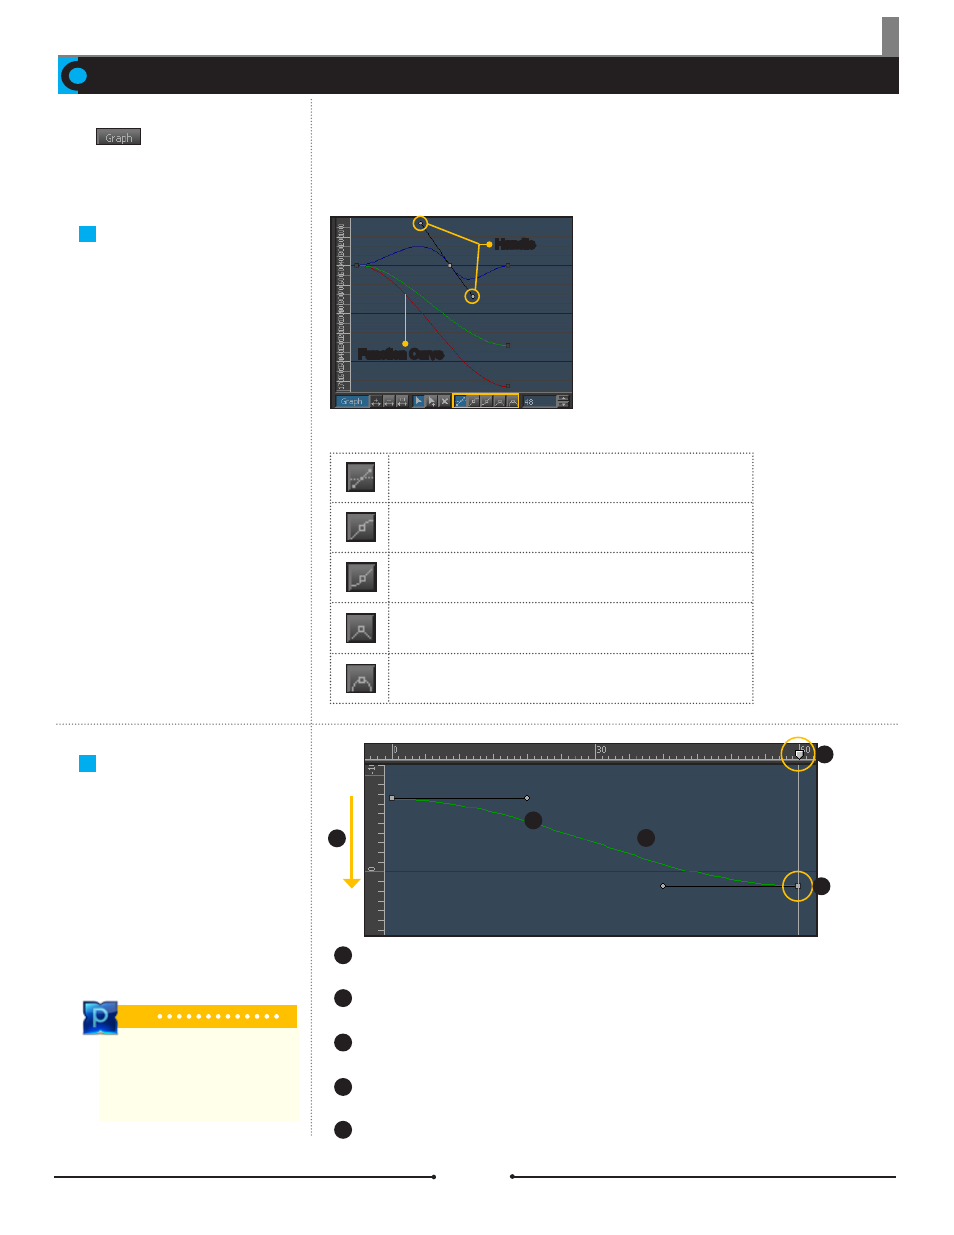
When is clicked, the attributes of animation will be displayed in a linear graph. Each track for position, rotation, scale, and slant
is separated into the X, Y, and Z axes in the graph. Each axis is displayed in a different color: X = Red, Y = Green, and Z = Blue.
Function Curve
In the graph, the squares rep-
resent Keys and the circles are
the tangent handles. In this view,
keys can be added and deleted
freely. Use the tangent handles
to manipulate detailed motions
of animations.
Graph Reading
Method
Clicking on the [Graph] button
displays animation attributes as
a graph.
Handle
Function Curve
Set tangents to custom
User sets the start and end values of the tangent.
Set tangents to slow
Turns the end value of a tangent to a straight line.
Set tangents to fast
Turns the start value of a tangent to a straight line.
Straighten tangents
Straightens the start and end values of the tangent.
Curve tangents
Curves the start and end values of the tangent.
Adjusting Values of Graph
Number of Squares:
Indicate the number of keyframes.
Time Ruler:
60 frames are equal to 2 seconds of animation time.
Green Graph:
Graph of the Y axis.
Descending Graph:
The values of corresponding attributes increase in a + direction (under 0 is +, above 0 is -).
Slope of Graph:
Displays the change in speed.
Tip
When the line graph is flat, there are
fewer changes in values. When the
line graph is steep, there are more
changes in values.
1
2
3
4
5
1
2
3
4
5
Compix Persona
121