Reject level example, Average gray scale results, Histogram – Banner PresencePLUS P4 Series User Manual
Page 106
Description
Control
Click this button to add a mask to an image. A mask
excludes an area inside the ROI.
Click this button to remove an ROI or a mask from an
image.
Use this field to rotate the ROI. You can manually key
in a rotation angle, or you can use the up or down
arrow keys to rotate the ROI.
Reject Level Example
Consider setting up an inspection for a relatively bright object that ranges from 180 to 200 in pixel intensity
and takes up 15 percent of the Field of View; yet, the remaining 85 percent of the Field of View ranges from
230 to 255 in pixel intensity. Setting a Reject Level of 220 will allow the tool to “pay attention” to only the bright
object being inspected. Further, masking the bright parts of the Field of View will not be necessary as only
pixels whose intensity is less than the Reject Level will contribute to bright Blobs. Note that rejected pixels are
colored orange in the histogram.
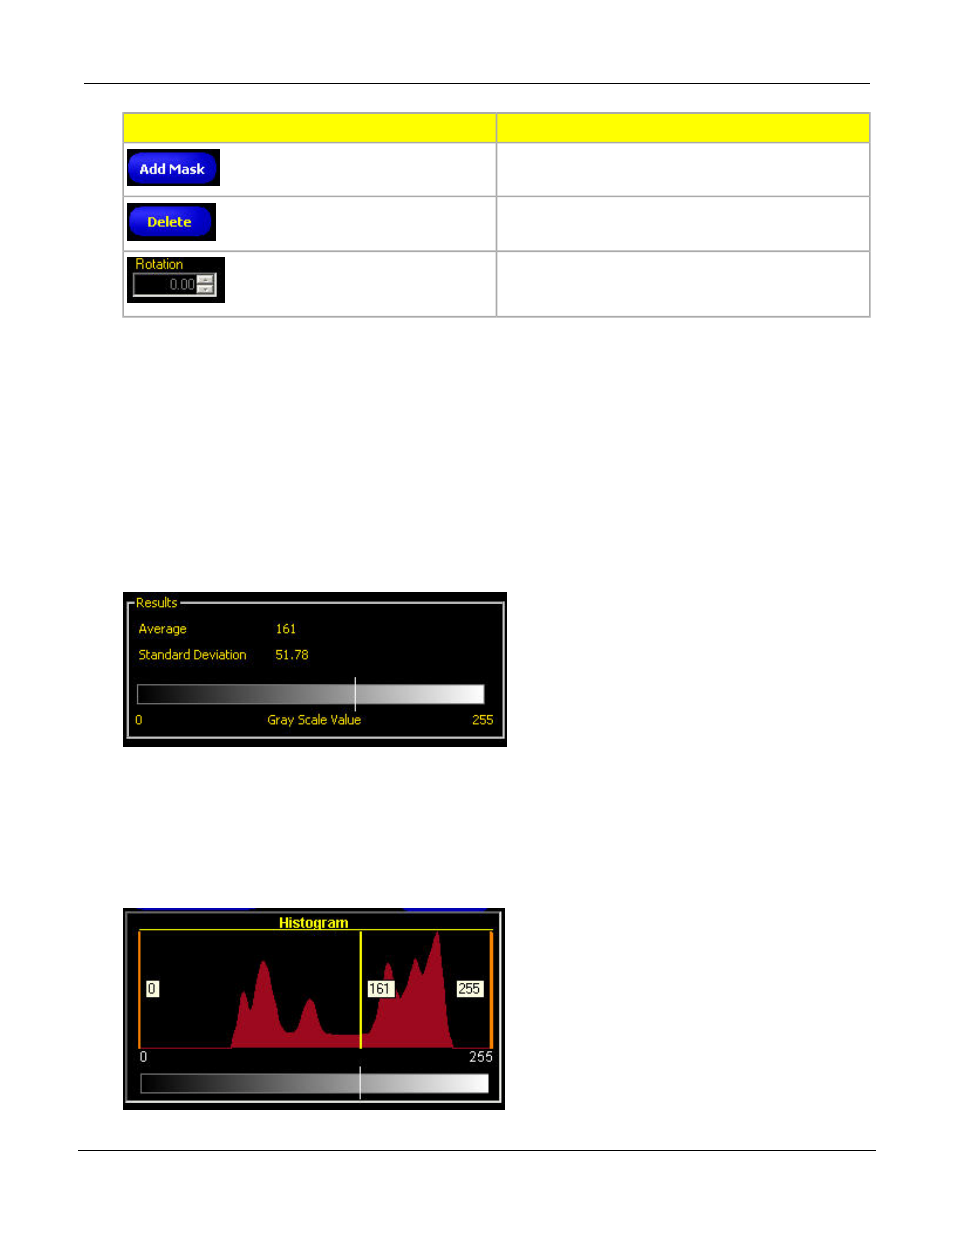
Average Gray Scale Results
The Results field returns the average gray scale value of the pixels in the ROI as well as the Standard Deviation.
Histogram
The Average Gray Scale tool has an optional Histogram feature. The histogram below, corresponds to an
Average Gray Scale tool ROI. The horizontal axis of the histogram is the individual pixel brightness values,
the vertical axis is a count of how many pixels in the Average Gray Scale ROI have that brightness.
P/N 000000
Banner Engineering Corp. - Minneapolis, MN USA - www.bannerengineering.com
Tel: 763.544.3164
106
7/2009
PresencePLUS Software Tools