Historical trend plot menu sub screen – TCI HGA Manual User Manual
Page 85
85
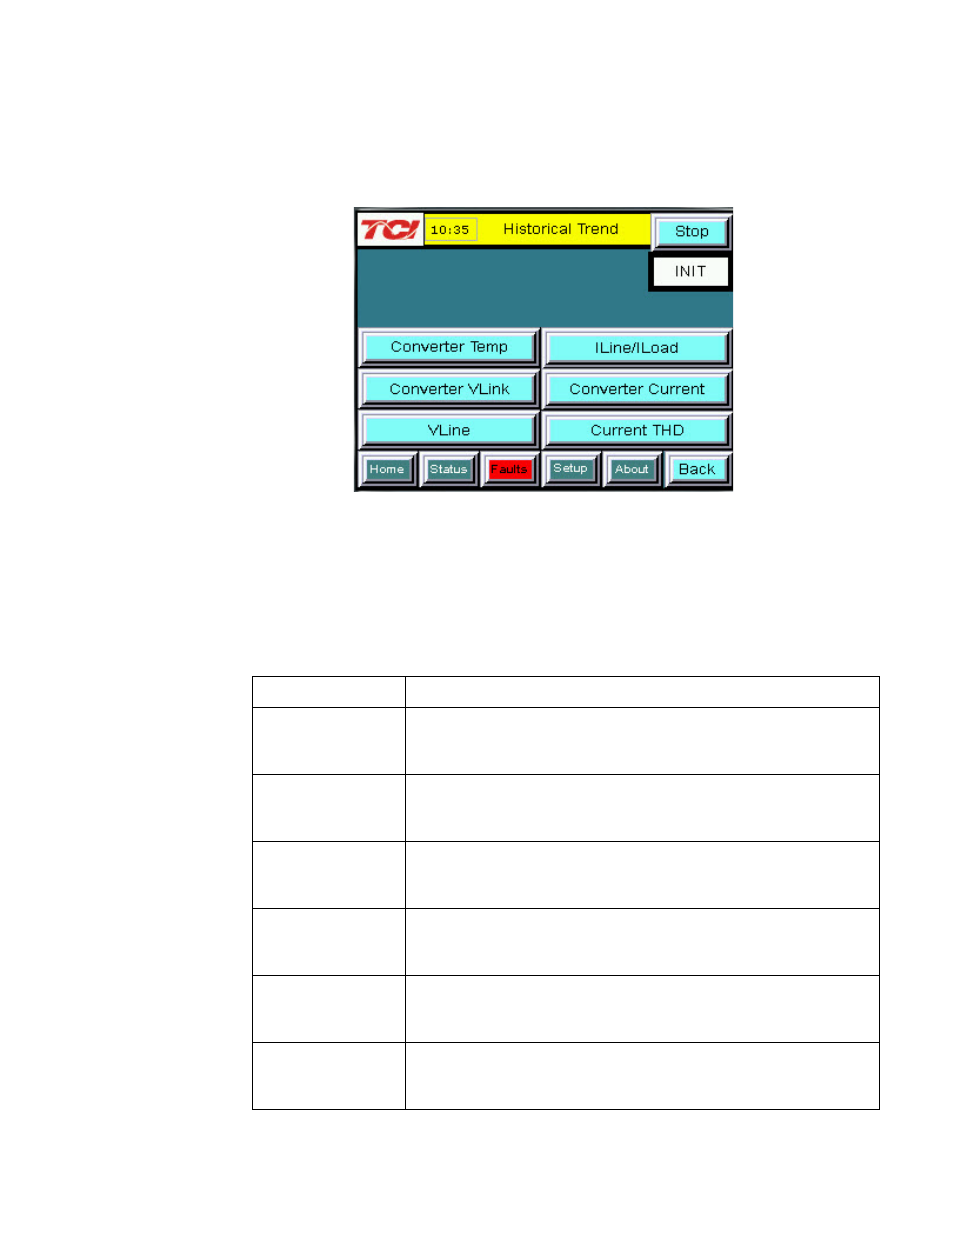
Historical Trend Plot Menu Sub Screen
From the historical trend plot menu sub screen you can view trend graphs of various HarmonicGuard Active
filter system signals (see Figure 7.10).
Figure 7.9 – Historical Trend Plot Menu Sub Screen
Table 7.9 – Historical Trend Plot Menu Sub Screen Elements
Screen Element
Description
Converter Temp
Button
Opens the HarmonicGuard Active filter heatsink temperature
historical trend graph screen. This signal is sampled every 15
seconds and historical data is maintained for 10 hours.
Converter VLink
Button
Opens the HarmonicGuard Active filter DC Link Voltage historical
trend graph screen. This signal is sampled every 3 seconds and 2
hours of historical data is maintained.
VLine Button
Opens the utility input RMS voltage historical trend graph screen.
This signal is sampled every 3 seconds and 2 hours of historical
data is maintained.
ILine/ILoad Button
Opens the line/load RMS current historical trend graph screen.
This signal is sampled every 3 seconds and historical data is
maintained for 2 hours.
Converter Current
Button
Opens the HarmonicGuard Active filter RMS current historical
trend graph screen. This signal is sampled every 3 seconds and 2
hours of historical data is maintained.
Current THD
Button
Opens the line/load Total Harmonic Distortion historical trend
graph screen. This signal is sampled every 3 seconds and 2
hours of historical data is maintained.