Waveform plot sub screens – TCI HGA Manual User Manual
Page 82
82
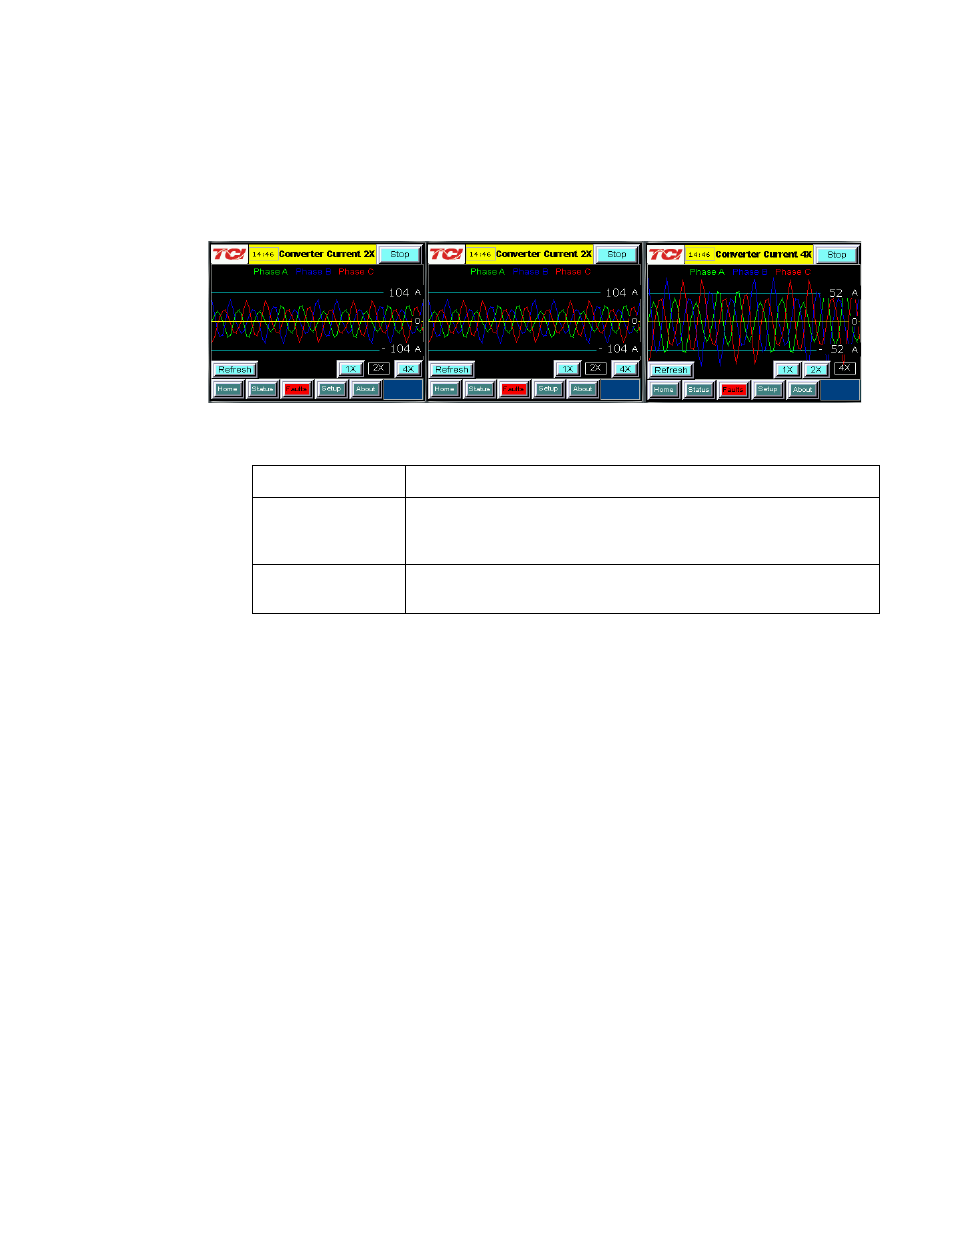
Waveform Plot Sub Screens
The HMI display supports capture and display of real time system voltage and current data. Three phase
waveform data can be viewed for Line Voltage, Line/Load Current, and Converter Corrective Current.
The waveform screens contain a zoom feature which supports three magnitude scales: 1 X, 2 X and 4X (see
Figure 7.7). The Refresh button on the waveform screens will update the plot with new data from the
HarmonicGuard Active filter converter.
Figure 7.7 – Example Waveform Plot Sub Screens (Converter Corrective Current)
Table 7.7 – Waveform Plot Sub Screen Elements
Screen Element
Description
Refresh Button
The “Refresh” button will reload the data from the HarmonicGuard
Active filter power converter controller and redraw the waveform
plot.
1X, 2X and 4X
Buttons
Waveform zoom buttons will redraw the present data at a different
scale.
VLine & ILine Waveform Plot Sub Screen
The VLine & ILine Waveform Plot Sub Screen is available to verify the proper installation of the
HarmonicGuard Active filter power connections and system current CT feedbacks. The waveform plot shows
voltage and current feedback for both Phase A and C on the same plot. When the HarmonicGuard Active
filter is powered, but in the stopped state this plot can be used to check for the following:
• Proper Line Voltage phase rotation
• Proper Line/Load Current phase rotation
• Proper Line Voltage and Line/Load Current relative polarity and phase.
• Missing/Open Circuit System Current CT Feedback
In the event that the HarmonicGuard Active filter performance is degraded the VLine & ILine waveform plot
should be examined as a means to determine if any system connection errors are present. Prior to examining
the VLine & ILine waveform plot, the HarmonicGuard Active filter should be put in the stopped state by
pressing the stop button in the upper left corner of the HMI screen. Figure 7.8 shows the VLine & ILine
waveform plot sub screen for a properly connected, but non-running HarmonicGuard Active filter when
connected to a typical non-linear, rectifier load. Note the following characteristics:
• Phase C voltage (Blue) leads Phase A voltage (Green).
• Phase C current (Yellow) leads Phase A current (Red).
• Phase A voltage (Green) and Phase A current (Red) are in phase and the same polarity.
• Phase C voltage (Blue) and Phase C current (Yellow) are in phase and the same polarity